A progress report (the deficit is increasing, if you were wondering…)

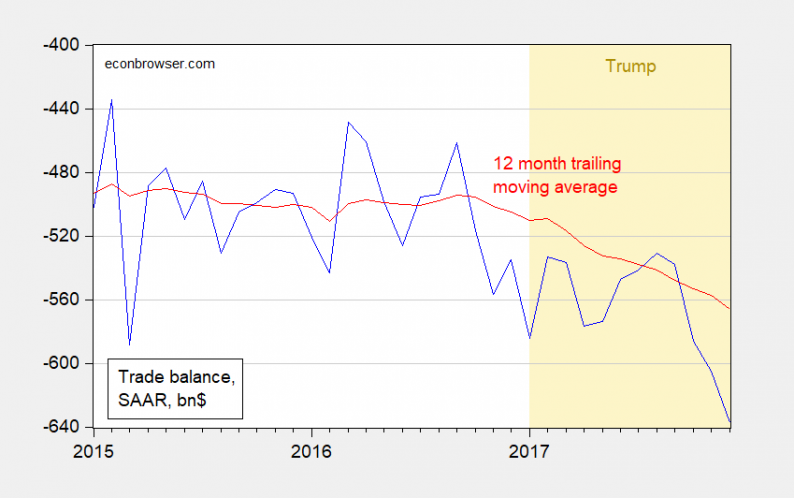
Figure 1: Trade balance in billions of dollars, SAAR (blue), and 12 month moving average (red). Orange denotes Trump administration. Source: BEA/Census December trade release, and FRED.
Notice the deterioration in the moving average of the trade balance starting around November. A longer perspective, normalized by GDP, is provided by Figure 2. In this figure, I depict a “non-petroleum” net exports series, to control

Figure 2: Net exports to GDP (blue), and net exports excluding petroleum products (red), both as a share of GDP. NBER defined recession dates shaded gray. Trump administration shaded orange. Source: BEA 2017Q4 advance release, NBER, author’s calcuations.
The non-petroleum deficit has increased over the past year, while the overall is roughly the same (as a share of GDP) as it was a year ago.
Since Mr. Trump has focused on manufacturing, it’s instructive to note that the manufacturing trade deficit has increased by $64.4 billion.
Now, things may change when Section 232 measures and other tariffs, duties and quotas are implemented. However, given saving and investment flows tend to drive the current account rather than the reverse, I’m not holding my breath for a big decrease in the trade deficit (unless a recession occurs as a consequence of a Trump-induced trade war — in which case the trade balance will improve).


Leave A Comment