Before we discuss the chart, a bit of technical history on crude oil and the price action of the ETF USO.
The peak low was made the week of December 12, 2016, at 7.67.
Gas prices were amazingly cheap then-what costs me $60 now to fill up my Range Rover, at that point cost more like $40.00.
Did I spend that saved money wisely?
Well, at the time, the best investment was the stock market.
A year later, the week of December 29, 2017, USO broke out from a base when it closed above 12.00.
Today, USO, with now potential double tops (short-term) at 13.30, has managed to hold 12.00 on a weekly closing basis, ever since that final breakout in 2017.
Now that it costs more to fill up our cars and while the stock market has issues, will the increasing oil prices pinch consumers, yet give futures traders an edge?
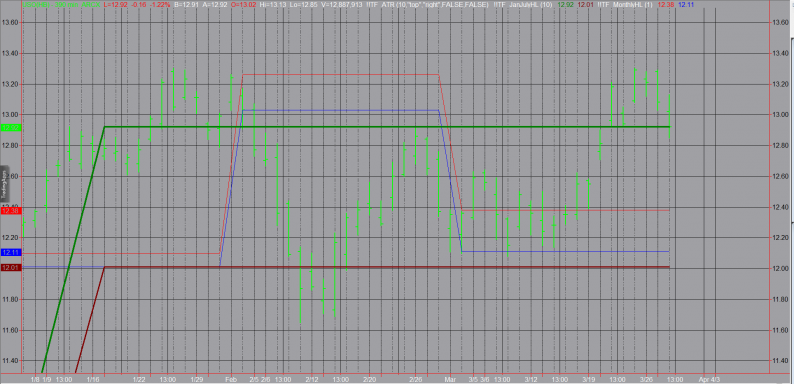
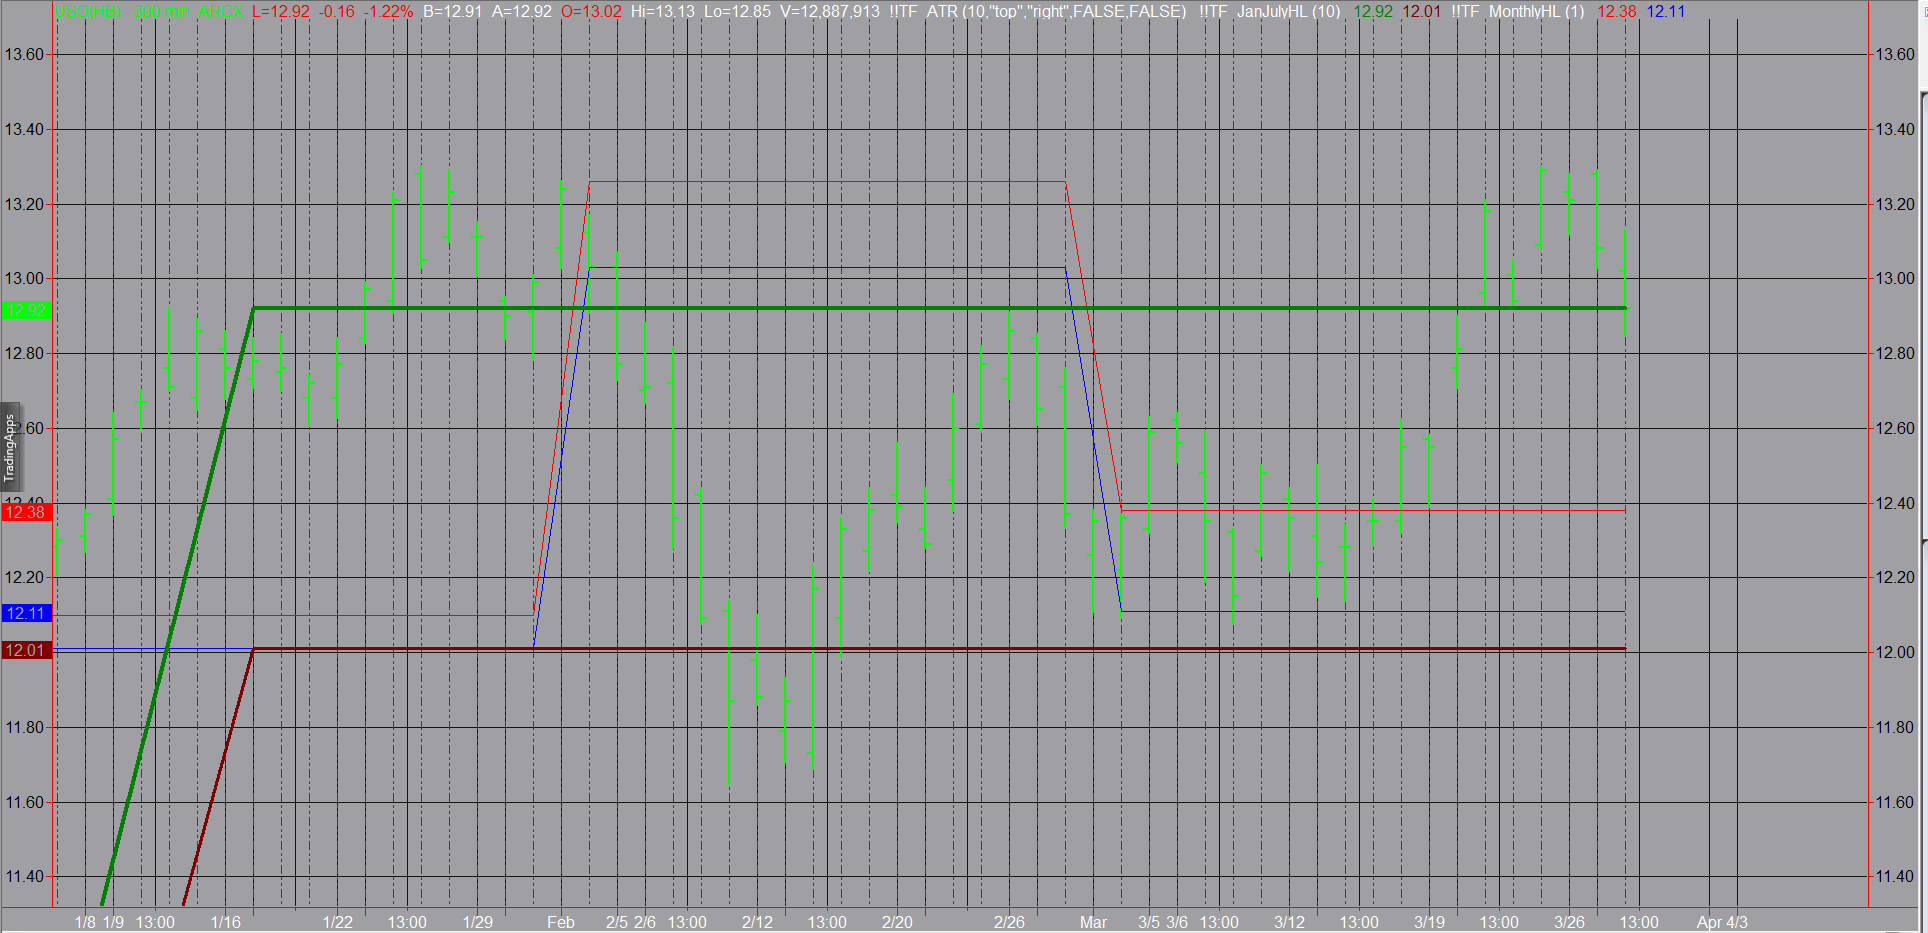
The chart is a bit different than what I typically share.
This is the 6-month calendar range chart that begins in January and goes until July.
The thick green line represents the 6-month calendar range high.
The thick red line represents the 6-month calendar range low.
At this point, USO is holding the calendar range high. That price is 12.93.
That is not necessarily a line in the sand, as I like to give it a little wiggle room.
The calendar range low is at 12.00. Again, an area, and not an exact point.
However, those points offer us some valuable information.
First off, they offer the knowledge that oil is in an uptrend. We also know this from the bullish phase it’s in.
Secondly, they offer us the technical point that 12.00 (area) should hold to keep the uptrend intact.
Finally, they offer us a trading plan that once USO clears 13.30, the next MAJOR resistance comes in at 15.50.
What would a major move up do to consumer’s wallets?
Well, considering the low unemployment numbers have yet to yield higher wages, it will hurt.
Furthermore, it will force the Fed to stay the course on rates. And, it will potentially spark inflation fears.


Leave A Comment