Commodities are becoming a hot topic… and an important investing theme. With the US Dollar coming back to life, commodities have pulled back. And that pullback now has the “equal weight” complex in trouble.
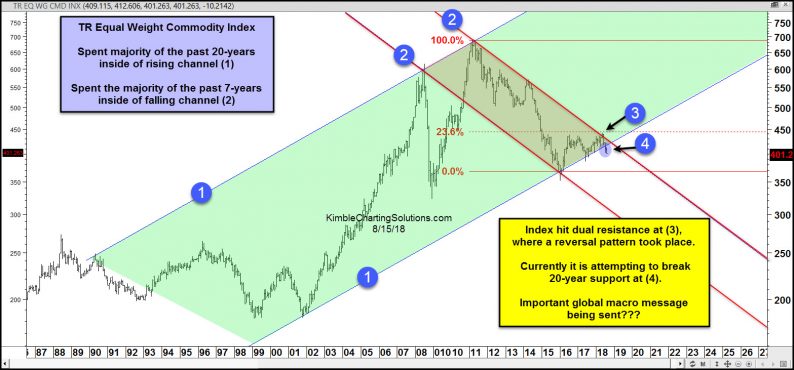
Below is a chart of the Thomson Reuters Equal Weight Commodity Index. The green shaded area represents a 20-year rising channel (point 1). Within that channel, however, commodities have formed a multi-year downtrend (point 2 – marked in red).
Using the all-time high and the early 2016 low, we can identify key Fibonacci levels. One level is the 23.6% Fib, which proved to be stiff resistance (point 3), marking a bearish reversal as well.
Currently, the Commodity Index is attempting to break 20-year channel support (point 4).
Investors should watch for follow-through selling on the Index (as confirmation).
Commodities just may be sending an important global macro message to investors!
Commodities Index “Long-Term” Monthly Bar Chart


Leave A Comment