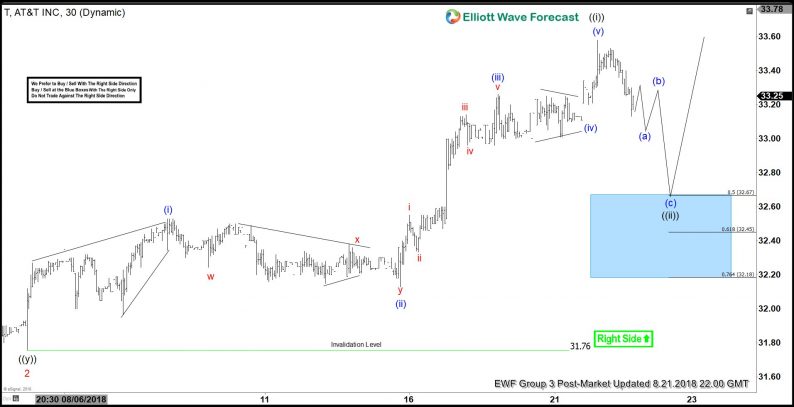
AT&T (ticker symbol T) short-term Elliott Wave view suggests that the pullback to $31.76 ended Minor wave 2. The stock is rallying from there within Minor wave 3 as an impulse structure with a nest. Up from $31.76, the rally to $33.58 ended Minute wave ((i)) of 3. The subdivision of Minute wave ((i)) is also unfolding as an impulse structure. Minutte wave (i) of ((i)) ended at $32.53, pullback to $32.13 ended Minutte wave (ii) of ((i). Minutte wave (iii) of ((i)) ended at $33.26 while Minute wave (iv) of ((i)) completed at $33.11. The last push higher to $33.58 ended Minutte wave (v) of ((i)) and completed the cycle from 8/3/2018 low ($31.76).
The stock is currently pulling back in Minute wave ((ii)) to correct cycle from 8/3/2018 low before the rally resumes. We don’t like selling the proposed pullback and expect dips to find buyers in 3, 7, or 11 swing as far as pivot at 8/3/2018 low ($31.76) remains intact in the first degree.
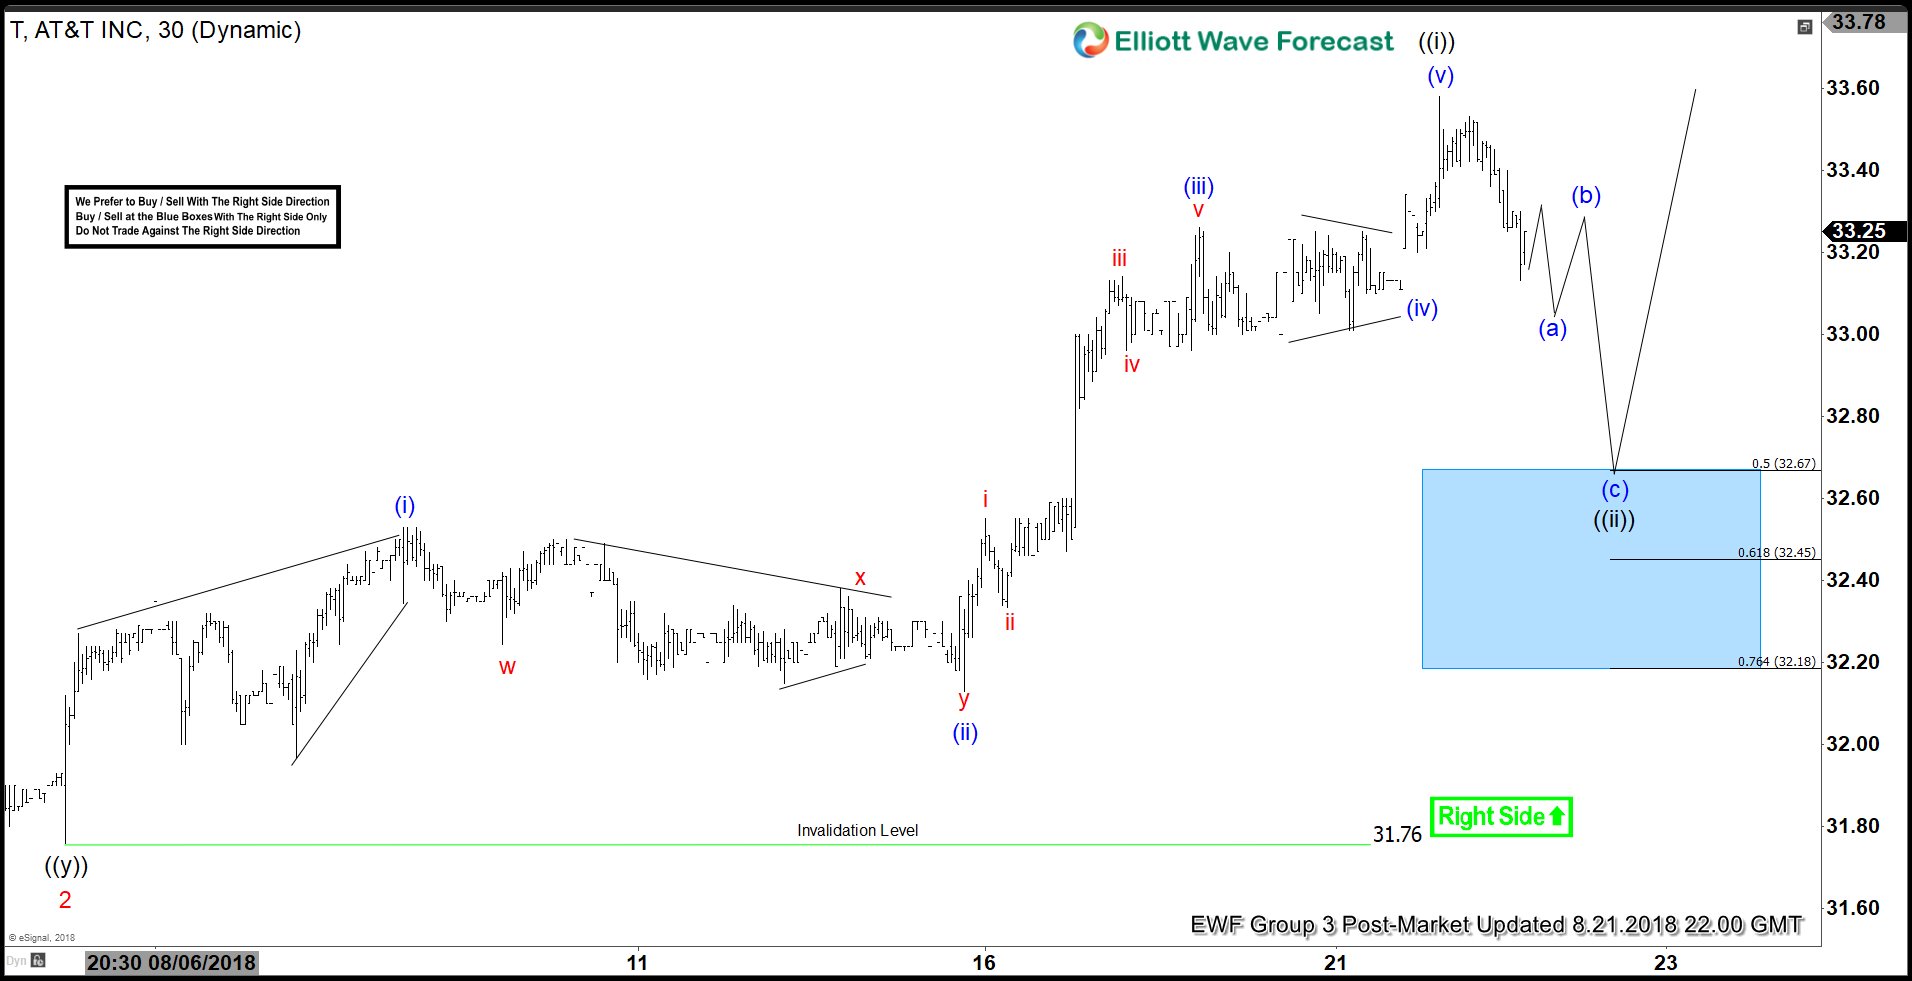
AT&T 1 Hour Elliott Wave Chart


Leave A Comment