Stock screeners allow investors to filter for nearly any quantitative metric. Dividend yields, price-to-earnings ratios, and payout ratios are easily found using the plethora of financial tools available today.
But how do investors filter for qualitative metrics, like business quality?
A great way to find high-quality businesses is by looking in the portfolios of famous investors with strong track records. One such investor is Bill Ackman, the founder and Chief Executive Officer of the hedge fund Pershing Square Capital Management.
Fortunately for individual investors, large funds like Pershing Square must disclose their holdings in a quarterly filing (called a 13F filing) with the U.S. Securities & Exchange commission. Pershing Square recently filed their 13F for the period ending 12/31/2017.
This article analyzes every holding in Bill Ackman’s stock portfolio in order of the amount Pershing Square owns.
Bill Ackman’s Investment Style
When people think of Bill Ackman, they often think of one of today’s most prominent activist investors. Activist investors take large stakes in underperforming companies with the hope to make changes to management teams and thus improve business performance.
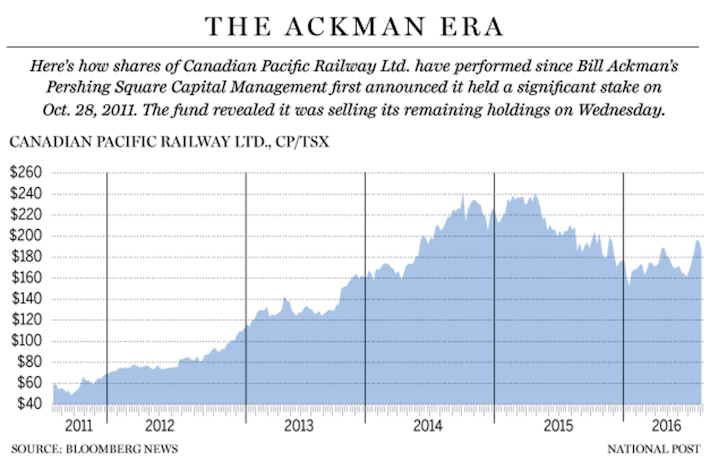
This strategy was seen in Pershing Square’s investment in the Canadian Pacific Railway Company (CP). Ackman first invested in this underperforming Canadian railway in 2011, where he saw an opportunity to improve its operating ratio (which is defined as operating expenses divided by net revenues).
At the time, CP Rail’s operating ratio was hovering around 90%, well above its peer group. This indicated major room for profitability improvements.
Ackman purchased $1.4 billion of stock in CP Rail, which gave his fund an ownership stake of 14.2%. This was enough to get Ackman elected to CP’s board of directors, where he implemented a new CEO – Hunter Harrison, a retired Chief Executive from rival Canadian National Railway (CNI).
Ackman and Harrison believed they could improve the company’s operating ratio from ~90% to ~65% in four years.
The rest, they say, is history. The following diagram displays the performance of CP Rail during the time period after Ackman’s investment.

Source: Financial Post
The CP strategy, which saw Pershing Square triple its original investment in less than five years, is a textbook example of Ackman’s activist investment philosophy.
Bill Ackman is also a very concentrated investor. According to his latest 13F filing, his top four holding compose 76.6% of his portfolio. Here’s how this compares to the top four holding concentrations of other famous investors:
Ackman’s portfolio exhibits less portfolio diversification among the top four positions than any of the three super-investors mentioned above.
A large reason why Ackman’s portfolio is highly concentrated is because of the nature of his investment strategy. To be an activist investor and make substantial changes to management and corporate governance, you need to own a large proportion of the underlying business. This leads Ackman to make concentrated bets, moreso than many other famous investors.
Moving on, Bill Ackman’s stock portfolio (sorted by market value) will be analyzed in detail.
Table of Contents
You can skip to an analysis of any of Bill Ackman’s stocks with the links below. Stocks are listed in order from lowest ownership to highest ownership. Pershing Square owned only 8 stocks at the time of its last 13F filing.
Valeant Pharmaceuticals International, Inc. (VRX)
Dividend Yield: 0.0%
Adjusted Price-to-Earnings Ratio: 1.7x
Percent of Bill Ackman’s Portfolio: 0.0% (Ackman has since sold his stake – the regulatory filing indicates 4.5%)
Pershing Square’s latest 13F filing showed the fund owned 18,114,432 shares of Valeant Pharmaceuticals (VRX) with a market value of $263,022,000. This is no longer correct.
Ackman has recently sold his stake in Valeant for a loss of approximately $4 billion – which caused 2015 and 2016 to be Pershing Square’s worst performance years ever. Since Valeant is known to no longer be a Pershing Square holding, it’s business model will not be covered in detail in this analysis. I will touch briefly on the events that led to Valeant’s precipitous stock price decline.

Source: Valeant Investor Relations
The reasons behind the decline in Valeant’s stock price are extremely complicated.
Valeant is a drug company that was once expected to revolutionize the pharmaceutical industry. Former Valeant Chief Executive Officer Michael Pearson grew the company by acquiring smaller drug companies with promising product pipelines and slashing costs wherever possible.
Often, these expense reductions were in the research & development department, which hurt the long-term prospects of Valeant’s subsidiary companies.
To make matters worse, Valeant typically financed these acquisitions with debt. The company was highly leveraged as a result. When the company delayed filing their 10-K in 2016 (more on that later), this broke debt covenants which meant that lenders could recall their bonds prematurely. Accordingly, investors were concerned about a possible default on Valeant’s debt.
Valeant’s business model also came under scrutiny when a Valeant executive was arrested for involvement in a fraudulent kickback scheme with Philidor Rx Services LLC, an entity created with the intention to facilitate money laundering.
The Valeant executive would run a large proportion of its business through Philidor, which was a mail-order pharmacy, helping to squash competition and increase profits for both Valeant and Philidor. The executive at Valeant responsible for the arrangement would ‘kick-back’ a portion of his large bonus to the CEO of Philidor in exchange for participating in the scheme.
When the Philidor scheme was made public, Valeant instigated a large internal review of its accounting procedures. This review ultimately delayed the filing of the company’s 10-K last April, which was why the company nearly defaulted on its outstanding debt.
With all that in mind, it is no surprise that Pershing Square’s Valeant investment was highly unprofitable. Highly leveraged companies that house money laundering schemes and are late making regulatory filings do not typically make attractive investments.
Bill Ackman’s fund originally purchased shares of Valeant in February and March of 2015. Valeant’s lost ~95% of its value between Ackman’s purchase and sale, which was reflected in the performance of his fund:
If Ackman held a more diversified investment portfolio, his fund would not have been affected as badly by the poor performance of Valeant.
Looking ahead, Valeant is trading at a bargain valuation (though it is still notan attractive investment). The company reported adjusted earnings-per-share of $5.47 for fiscal 2016, which means that today’s stock price of $9.48 represents a price-to-earnings ratio of just 1.7x.

Source: Valeant Fourth Quarter Investor Presentation, slide 5
The reason why Valeant’s current valuation multiple is so low is because of the vast amount of uncertainty regarding the company’s future.
Its attractive valuation does not make up for fraud allegations and predatory drug pricing. The price-to-earnings ratio is not an accurate valuation metric when we don’t know if the underlying earnings are real because of instances of fraud.
For income investors, Valeant also does not pay a dividend.
As such, Valeant remains a sell despite its depressed price, and investors who continue to hold the stock are exposing them to high risk and the potential for increased stock price volatility if more fraud schemes are made public.
Pershing Square’s investment in Valeant has been widely publicized. For investors interested in learning more about Ackman’s investment thesis for this company, the following articles might be of interest:
Nomad Foods Limited (NOMD)
Dividend Yield: 0.0%
Adjusted Price-to-Earnings Ratio: 12.7x
Percent of Bill Ackman’s Portfolio: 5.4%
Pershing Square Capital Management owns 33,333,334 shares of Nomad Foods Limited (NOMD) with a market value of $319 million. This position represented 5.4% of the fund’s invested assets at the time of its last 13F filing.
Nomad Foods is a branded frozen foods producer in Europe. The company is a fairly new publicly-traded security, completing an IPO on the London Stock Exchange in 2014.
On January 12, 2016, Nomad Foods transferred its common stock to the New York Stock Exchange under the current ticker NOMD, where it continues to trade today.
Nomad Foods is a mid-cap stock with a market capitalization of ~$2 billion. The company has operations across 17 countries in Western Europe and enjoys a 13.8% market share in the frozen food market ex-ice cream.

Source: Nomads Food April 2017 Investor Presentation
Nomad Foods benefits from market leadership in many of the geographies that it serves. The company is the #1 branded frozen food company in 10 different countries, with its primary brands being Birds Eye, Iglo, and Findus. Consumers recognize a Nomad Foods brand by its distinctive red logo style.
Nomad Foods operates a business model that is split by geography. For example, the Birds Eye brand operate in the U.K., the Findus Brand operates in Italy, Sweden, and France, and the Iglo brand operates in Germany.
The following diagram displays the company’s business breakdown by geography.

Source: Nomads Food April 2017 Investor Presentation
The geographic diversity of Nomad Foods does not stop at the consumer level. The company’s manufacturing facilities are also spread across Europe.
In light of recent geopolitical uncertainties (notably Brexit) this manufacturing diversity should protect investors in the event that more countries make choices that effect inter-border trade agreements. Some countries are considering following the U.K.’s decision last summer to leave the European Union.
The following diagram shows the locations and key stats of Nomad’s 10 best-in-class manufacturing facilities.

Source: Nomads Food April 2017 Investor Presentation
Looking ahead, Nomad Foods has a well-defined strategic vision to propel the company’s future. It is divided into three buckets.
The first is operational excellence. Nomad aims to eliminate costs and boost margins as a method of increasing earnings-per-share.
The second is to consolidate frozen. Like Hormel Foods (HRL), a U.S.-based company that is similar to Nomad Foods, the company often acquires up-and-coming food brands and then scales them through their cost-effective distribution and advertising network.


Leave A Comment