
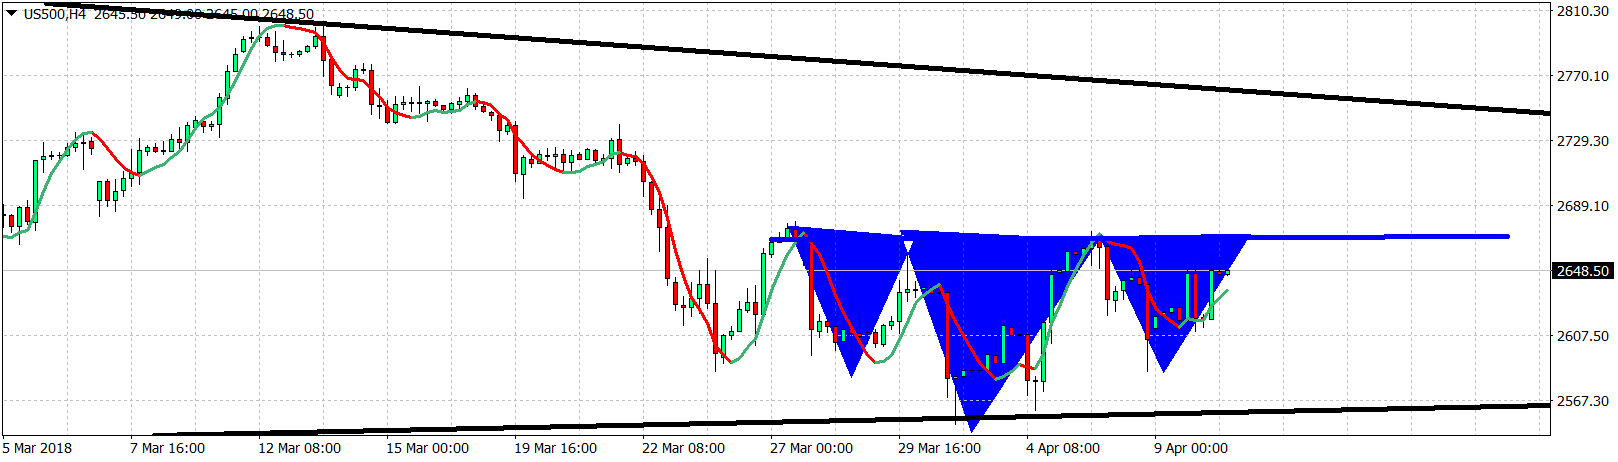
Take a look at what I saw in my SPX chart…an inverted head and shoulders pattern with the neckline at 2670. Break above it and we could sea push towards the upper triangle boundary and downward sloping resistance trend line.
The pattern
The target
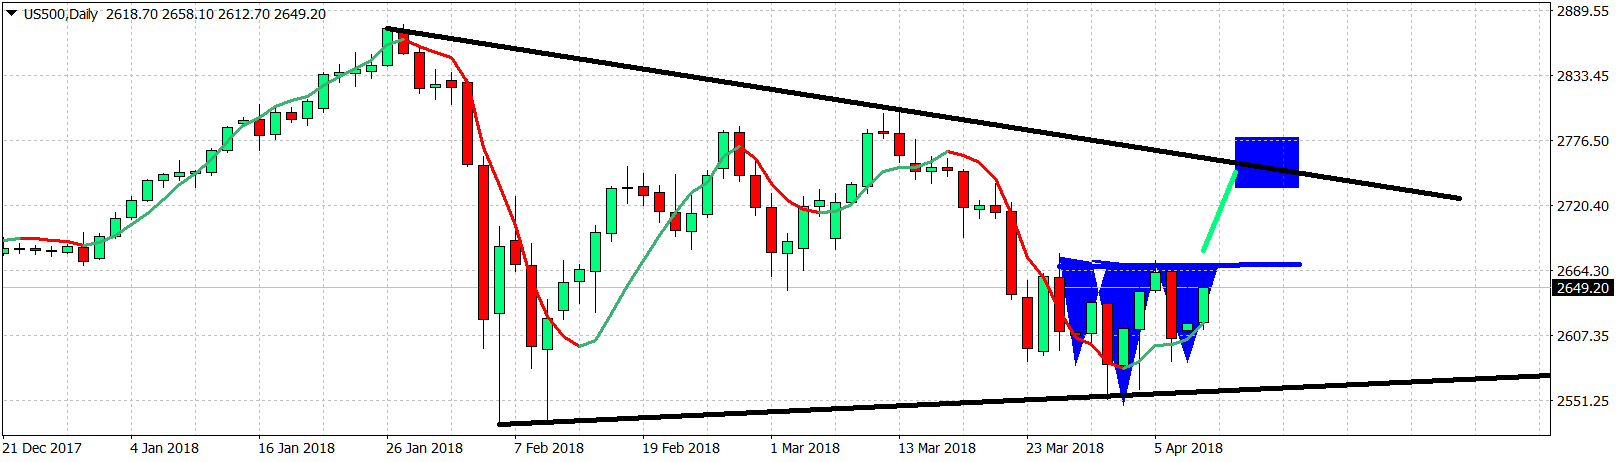
What have seen so far? Every time price moves towards 2600-2580 area is being defended. Big test for bulls and big bullish signal will be the break out above the upper black trend line resistance. New highs over the next three months? why not…..


Leave A Comment