
I thought I would do a deeper dive to revisit the currencies and US Dollar again, because there are a lot of comments out in cyberspace and the general media about how things are not that bad.

The US stock market is having a massive short-covering rally, which is merely a mechanical knee-jerk reaction to an oversold condition. As I mentioned last week, there is still going to be another 2-3 weeks of upside in the “other currencies” and commodities, but when a top is put in place, one will want to make sure they are sitting on a chair, because it will get ugly.
Currencies
The daily chart of the Canadian Dollar Index is shown below, with the lower 21 MA Bollinger Band beneath the 34 and 55 MA Bollinger Bands in close proximity to each other indicates an oversold condition has been generated (A mild overbought condition has been generated, but two Bollinger Bands under the 21 MA Bollinger Band trumps the other). Full stochastics 1, 2 and 3 are shown below in order of descent, with the %K above the %D in all three instances. Extrapolation of the %K in stochastics 2 and 3 suggest another 3-5 weeks of sideways to upward price action before a top is put in place. The likely area for topping out remains between 79 and 80…anything higher would be extremely short lived and make the next leg down that much harder.

Figure 1 – Click on chart for a sharper image
The daily chart of the Australian Dollar Index is shown below, with the upper 21 MA Bollinger Band above the 34 MA Bollinger Band indicates an overbought condition has been generated. Also, a price excursion above the upper 21 and 34 MA Bollinger Bands suggests a pause in price is likely over the next 2-4 days before any upside move occurs. Full stochastics 1, 2 and 3 are shown below in order of descent, with the %K above the %D in all three instances. The Aussie Dollar has risen 5 cents over the past month, so at the upside is limited to 76-78. There is a little more of a broader range for a top compared to the Canadian Dollar. There is the potential for another 2-3 weeks of upside before any sort of a top is put in place.
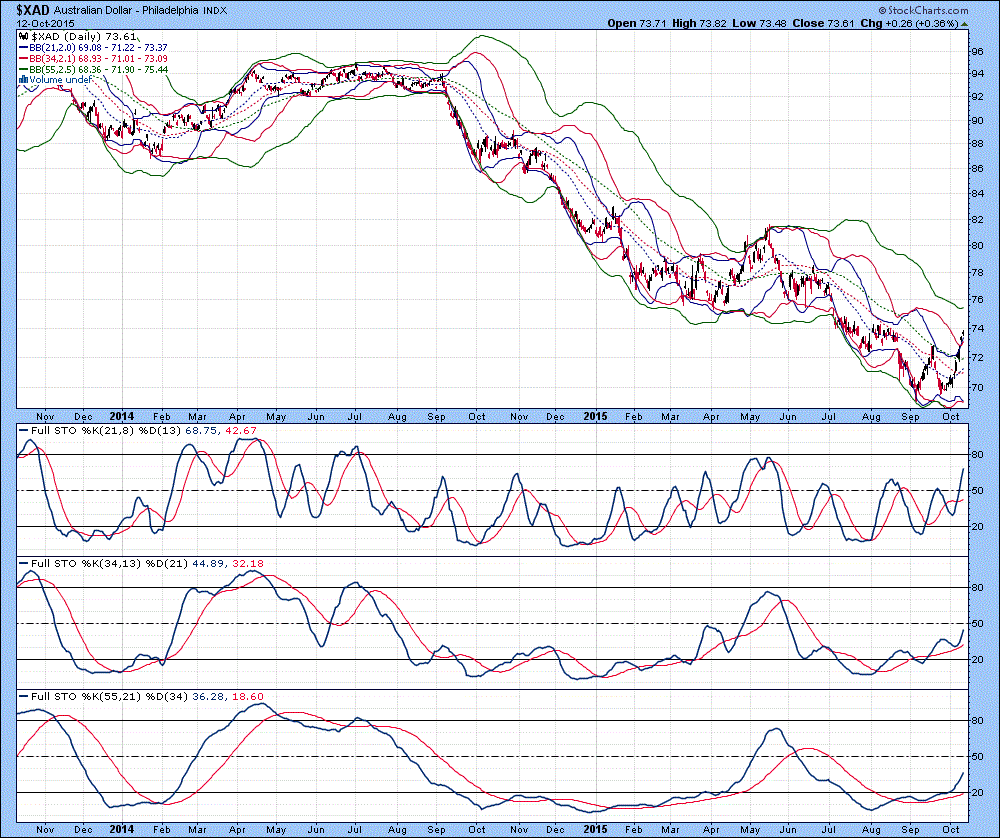
Figure 2 – Click on chart for a sharper image
The daily chart of the Euro Index is shown below, with Bollinger Bands in their proper order of alignment indicates no overbought or oversold conditions exist at this point in time. There is currently a quadruple top in place, at 114, so a breakout above 114.5 on a weekly basis could see a move to 120. Full stochastics 1, 2 and 3 are shown below in order of descent, with the %K above the %D in 1 and 3 and beneath the %D in 2. Extrapolation of the %K trend in stochastic 1 suggests 2-3 weeks of continued sideways to upward price action before any sort of a top is put in place. As with many commodities, there was a strong surge last week, so expectations of another 2-4 days at a minimum of sideways price action before another move higher should be considered.


Leave A Comment