
The latest Conference Board Consumer Confidence Index was released this morning based on data collected through November 14. The headline number of 129.5 was an increase from the final reading of 126.2 for October, an upward revision from 125.9, and remains at a 17 year high. Today’s number was above the Investing.com consensus of 124.0.
Here is an excerpt from the Conference Board press release.
“Consumer confidence increased for a fifth consecutive month and remains at a 17-year high (Nov. 2000, 132.6),” said Lynn Franco, Director of Economic Indicators at The Conference Board. “Consumers’ assessment of current conditions improved moderately, while their expectations regarding the short-term outlook improved more so, driven primarily by optimism of further improvements in the labor market. Consumers are entering the holiday season in very high spirits and foresee the economy expanding at a healthy pace into the early months of 2018.”
Putting the Latest Number in Context
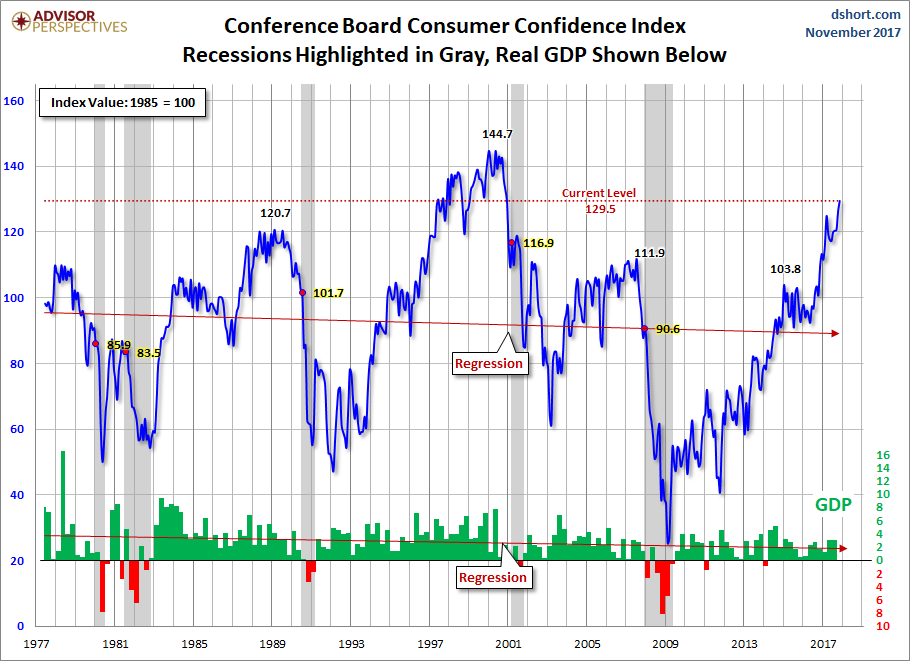
The chart below is another attempt to evaluate the historical context for this index as a coincident indicator of the economy. Toward this end, we have highlighted recessions and included GDP. The regression through the index data shows the long-term trend and highlights the extreme volatility of this indicator. Statisticians may assign little significance to a regression through this sort of data. But the slope resembles the regression trend for real GDP shown below, and it is a more revealing gauge of relative confidence than the 1985 level of 100 that the Conference Board cites as a point of reference.
On a percentile basis, the latest reading is at the 93rd percentile of all the monthly data points since June 1977, up from the 91st percentile the previous month.
For an additional perspective on consumer attitudes, see the most recent Reuters/University of Michigan Consumer Sentiment Index. Here is the chart from that post.


Leave A Comment