
We have already observed how oil and precious metals are looking set to turn lower, especially oil, and the medium-term bearish outlook for these commodities is confirmed by the negative setup that we will now examine on the latest charts for copper. Ordinarily we are not all that interested in copper, because there are few suitable trading vehicles we can use to play it, so our interest is mainly due to its implications for other markets.
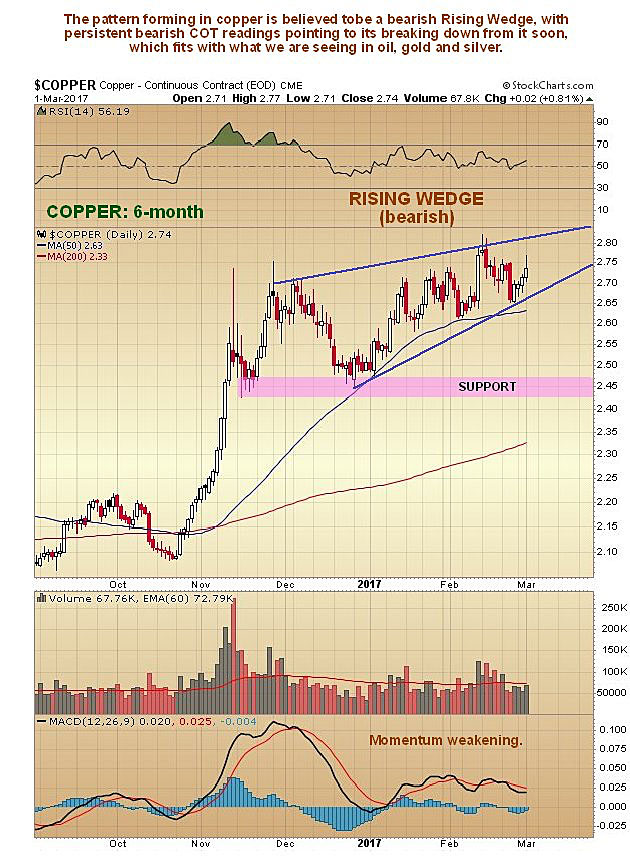
On its 6-month chart we can see how the sharp rally in copper last October and November has been followed by a largely unsuccessful attempt to push higher, and the pattern that has formed now looks like a bearish Rising Wedge, accompanied by dwindling upside momentum which is increasing downside risk.
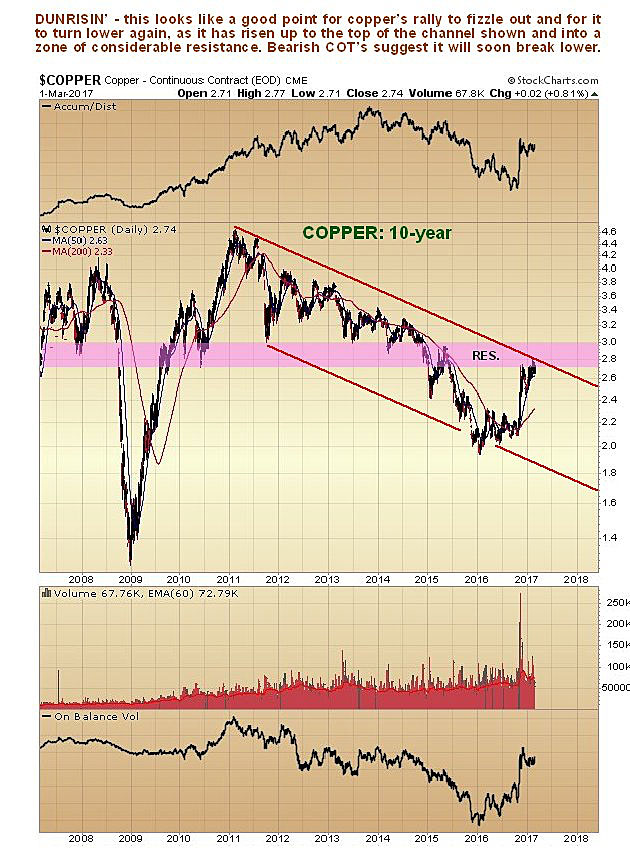
The long-term, 10-year chart also gives rise to concern, for on it we can see that not only has the rally brought copper to the upper boundary of its major downtrend channel, but it has also brought it up into a zone of quite heavy resistance, so it is not hard to understand why it is having trouble making any further progress, and is increasingly vulnerable to turning lower again.
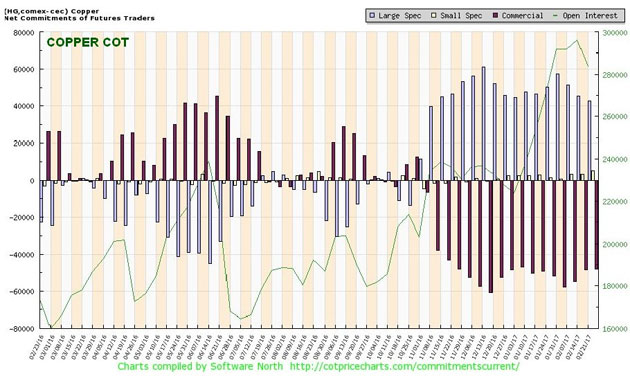
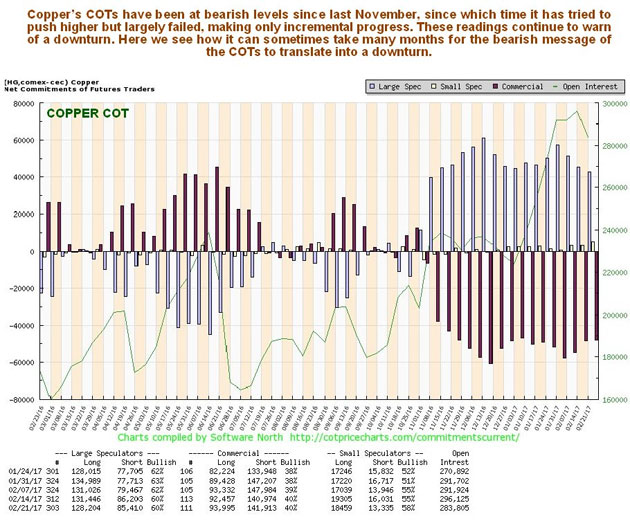
By mid-December copper’s COTs had turned decidedly bearish, and they have stayed that way ever since, with high Commercial short and large spec long positions proving a major impediment to further gains, and continuing to threaten to force copper back down again.
Copper’s latest hedgers chart looks awful, like oil’s, with it close to record extremes. This chart indicates a high probability that copper will soon break down and drop hard.

Chart courtesy of sentimentrader.com
Finally, the latest copper optix, or optimism chart, shows excess bullishness, which again should translate into lower copper prices before much longer.


Leave A Comment