
The test of the resistance line, the triangle apex reversal, the a-b-c waves in the zigzag pattern… What connects them? Give us 28 paragraphs and 975 words and you will see that these seemingly mismatched concepts will form a meaningful and promising scenario.
Technical Analysis of Crude Oil
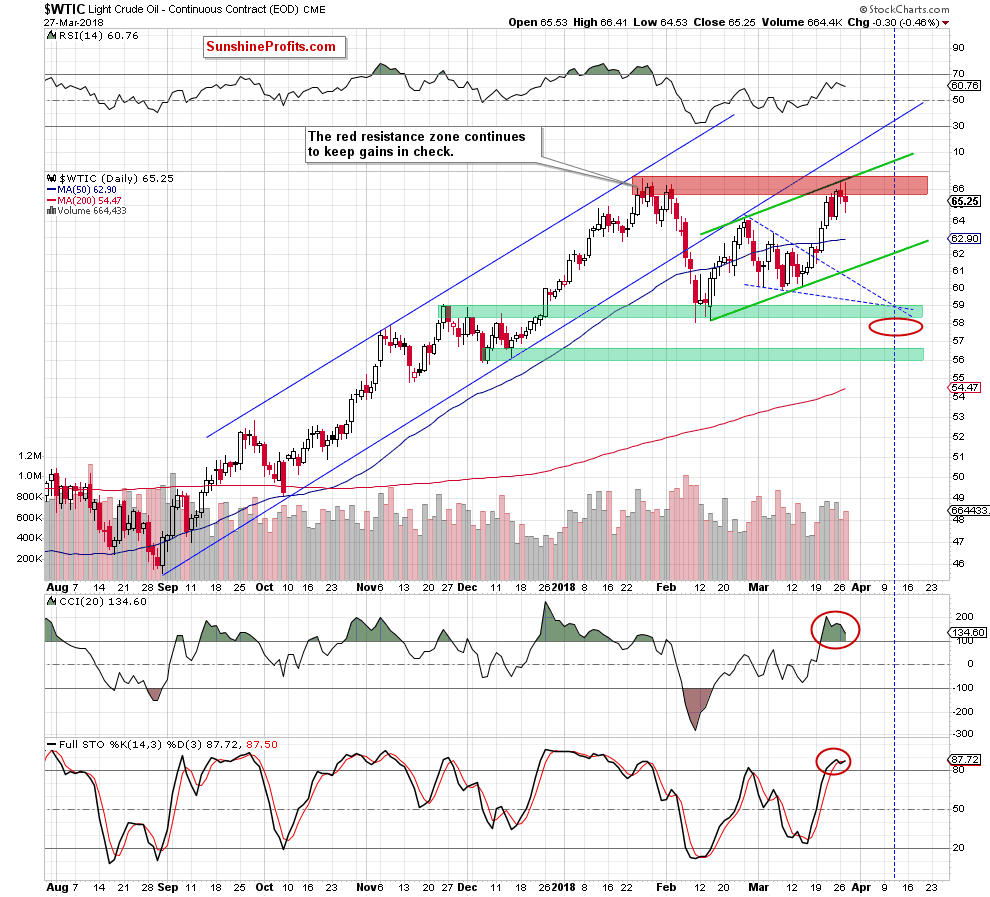
Let’s start with the well-known daily chart (charts courtesy of http://stockcharts.com).
In our last Oil Trading Alert, we wrote the following:
(…) oil bulls took control shortly after the opening of the Friday session (…) and climbed to the major resistance zone, which stopped light crude’s rally at the end of January, triggering declines in the following weeks.
Will history repeat itself once again and we see similar price action in the coming days?
As you see on the daily chart, the red resistance zone created by the previous 2018 peaks is currently reinforced by the upper border of the green rising trend channel, which suggests that reversal may be just around the corner – especially when we factor in the fact that the daily indicators increased to their overbought areas, which could translate into sell signals in the very near future.
From today’s point of view, we see that the situation developed in tune with our assumptions and crude oil reversed and pulled back after the test of the upper border of the green rising trend channel, which suggests further deterioration in the coming days.
But will we really see the next downward move in near future? After all, oil bears disappointed us many times during the last month, so why should it be different now and why we should trust them?
The Reasons
First, the bears have on their side the above-mentioned strong resistance zone, which successfully stopped their opponents two times earlier this year.
Second, the Stochastic Oscillator generated the sell signal.
Third, Elliott wave theory…


Leave A Comment