
The EUR/USD bounced from the lows it reached on Thursday, but further upside moves may be limited.
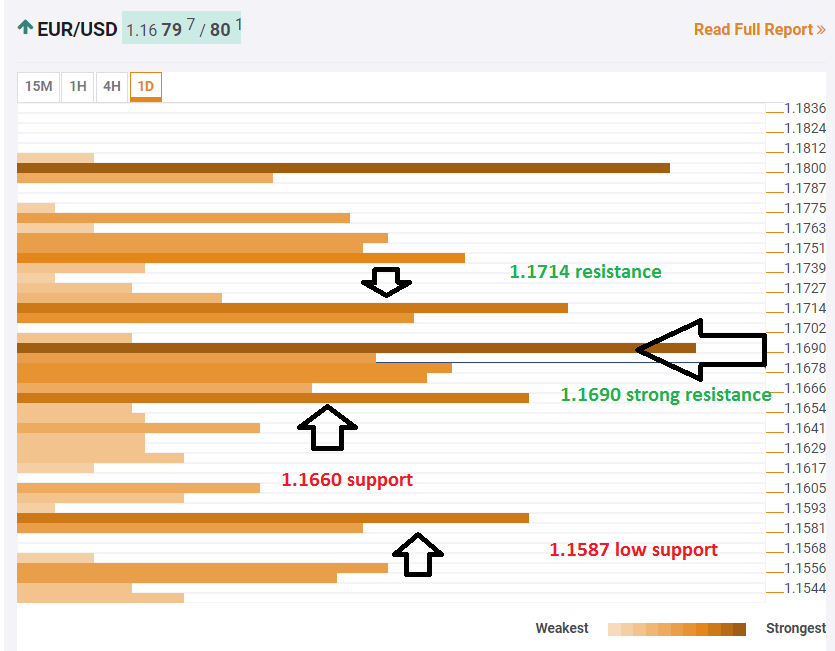
The Technical Confluences Indicator shows that the pair faces initial and significant resistance at 1.1690. This includes the Simple Moving Average 10-4h, the Bolinger Band 4h-Middle, and the Fibonacci 61.8% one-day.
Close by, 1.1714 is another significant line of resistance. This is the convergence of the Pivot Point one-week Resistance 1, the PP one-day R1, and the Fibonacci 38.2% one-month.
Some support awaits at 1.1660 which is the meeting point of the Fibonacci 61.8% one-month, the Fibonacci 23.6% one-day, and the Bolinger Band four-hour Lower.
The next noteworthy confluence of support lines is only at 1.1587where we see the Fibonacci 23.6% one-week, the Simple Moving Average 200-4h, and the Pivot Point one-month Support 1.
Here is how it looks on the tool:
Confluence Detector
The Confluence Detector finds exciting opportunities using Technical Confluences. The TC is a tool to locate and point out those price levels where there is a congestion of indicators, moving averages, Fibonacci levels, Pivot Points, etc. Knowing where these congestion points are located is very useful for the trader, and can be used as a basis for different strategies.
This tool assigns a certain amount of “weight” to each indicator, and this “weight” can influence adjacents price levels. These weightings mean that one price level without any indicator or moving average but under the influence of two “strongly weighted” levels accumulate more resistance than their neighbors. In these cases, the tool signals resistance in apparently empty areas.


Leave A Comment