One of the largest questions that faces investor is what asset classes to invest in.
The two largest are stocks (equities) and bonds (fixed income).
How can an investor know which asset class to invest in, or what proportions should be used in a mixed strategy?
It all comes down to your fundamental investment goals. We believe the goal of any investor should be either:
Incorporating both return and risk into an investment strategy can be difficult. While performance is easy to measure, risk can be more difficult to quantify.
After all, how do we define risk? Is it the probability of losing money (which itself is hard to estimate), or something else?
The investment community has generally accepted volatility as the best measurement for investment risk. Volatility is a stock’s tendency to ‘bounce around’. Low volatility dividend stocks will produce consistent returns, while high volatility stocks have more unpredictable return sequences.
With this in mind, dividend stocks have historically produced superior total returns compared to their fixed income counterparts. This is because established dividend stocks like the Dividend Aristocrats – stocks with 25+ years of consecutive dividend increases – have generated superior performance that more than offsets their higher volatility relative to bonds.
For this reason, we believe dividend stocks are a compelling investment opportunity when compared to bonds – their biggest ‘competitor’ as an investment.
This article will compare the risk-adjusted returns of dividend stocks and bonds in detail. The article will conclude by detailing a few actionable ways that investors can improve the risk-adjusted returns of their portfolio.
Measuring Risk-Adjusted Returns
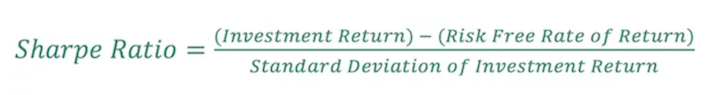
The most common metric to measure risk-adjusted returns is the Sharpe Ratio.
The Sharpe Ratio measures how much additional return is generated for each unit of risk. It is calculated with the following equation:

One of the tricky elements of performing a Sharpe Ratio analysis is determining what to use for the risk-free rate of return. When analyzing stocks, the 10-year U.S. government bond yield is often used, as the probability of a default from the U.S. Government is generally assumed to be zero.
However, this article will be analyzing both stocks and bonds, so using a 10-year bond yield as the risk-free rate would be inappropriate (as it will assign a Sharpe Ratio of zero to fixed-income instruments). Accordingly, the yield on the 3-month U.S. Treasury Bill will be used as the risk-free rate of return throughout this article.


Leave A Comment