
Futures positioning was relatively subdued to start the month of September. Sentiment vs the US dollar was mixed in the last week of the unofficial summer season, but then declined across-the-board after returning from holiday (US Labor Day) weekend, only to finish the week at multi-year lows. The latest Commitment of Traders (COT) report (ending September 5), also featured a record (net) long position in the euro futures contracts, and the continued unwind of the so-called (Japanese) yen “carry-trade.”
Meanwhile, central bank rhetoric continued to be a focal point for forex traders. Last week’s BOC’s (Bank of Canada) unexpected rate hike boosted the Loonie (Canadian dollar) to another 2-year high vs the USD, and the ECB’s mum view on recent currency appreciation helped drive the euro to new multi-year highs vs the USD. In other developments, interest rates reached new lows for the year, US equities continue to consolidate near all-time highs, and Gold futures continued to trade higher towards the 2016 peak.
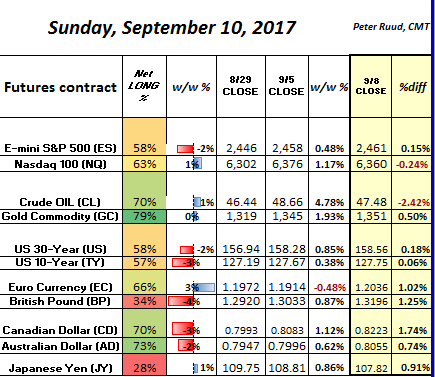
FX futures positioning vs the US dollar in the early portion of the month (of September) was relatively subdued for the 2nd straight week . Data from the latest COT report (ending September 5th) was mixed in the FX space as bearish bets vs the British pound rose again, while the Aussie and Loonie pared-back their rather extreme (net) long positions. Sentiment towards the Japanese yen and euro, meanwhile,saw modest increases vs the greenback. Speculator’s had been paring back bearish bets against the yen or the so-called “carry trade”, as the percentage of long positions improved for the 6th straight week. Although the net increase was a mere percent, it continues to highlight the short-covering of the yen carry trade that had recently reached a 2-year high. After the holiday weekend, the USD/JPY gapped lower only to finish the week below 108, the lowest level since Trump was elected president. While price-action remains capped by 108.67 (to the upside), the next downside target is located at 106.50 (key Fibonacci retracement) ahead of the psychological 105 region.
The EUR/USD pushed through the psychological 1.20 mark again, closing above it for the first time since late 2015. The 10-month improvement in euro positioning, which had seemingly stalled as of late, increased by 3% to highlight the largest net long position by (non-commercial) speculators on record. While price-action and sentiment may be at extremes, their trends remain strong and could be supported by the move seen by retail traders last week, which saw them fight euro strength (according to recent Retail FX data). The next key (upside) objective is 1.2138 or the mid point of the overall range since 2014, ahead of 1.2570 or the corresponding 61.8% (Fibonacci) retracement. If, however, the EUR/USD fails to materially take out the 1.2070 area to the upside, then it could st the stage for a broader correction.
It was similar story for the British pound last week, as retail FX traders jumped-out-the-gate fighting Sterling strength. As for sentiment, large speculators reduced their exposure (to the pound) once again, suggesting that non-commercial traders under-owned the British currency. This hints of a re-test of the August peak at 1.3267 (GBP/USD), which if cleanly broken could expose the psychological 1.35 region. That said, if next week turns out to be bearish (technically), then it could lay the groundwork for a topping pattern vs the USD.
Bullish sentiment by Australian dollar large speculators has stalled as of late, ever since net longs reached 78% over a month ago. Price-action in Australian dollar futures, however, moved briefly above the July high at .8066 before pulling back slightly. Technically, Friday’s bearish reversal highlights divergences on both weekly and daily charts, but could be a temporary exhaustion if the Aussie quickly regains its footing early next week. If risk aversion persists, however, an inability to clear .8066 could re-enforce these technical headwinds and extreme (long) positioning in the Aussie.
Canadian dollar bullish sentiment by large speculators has steadied since early August after having seen both the net long tally and net long percentage advance the prior 3 months. Meanwhile, after last week’s surprise rate hike by the BOC, the USD/CAD thrusted to a fresh 2-year low, closing under 1.21 on Friday. The most recent retail FX data indicates that the retail trading population is starting to follow Loonie strength, which is typically bearish.Also, with weekly RSI diverging, further Canadian currency strength could be rather limited until the rather crowded net long position by futures speculators can unwind a bit. That said, the technical breakdown in the USD/CAD looms large and could extend lower while broad dollar weakness persists.
Gold futures sentiment continues to show improvement, as both net positions by total and by percentage ticked up for the 8th straight week. More importantly, Gold futures have continued to build upon the latest monthly chart breakout of a 6-year bear trendline, which has gold bulls poised to re-test the 2016 peak at 1375 in the near-term. After having broken down in mid-August to fresh lows of optimism, retail traders seemingly returned in fighting gold strength, which should temporarily aide Gold bulls as well. That said, Friday’s price-action serves as a reminder of how overbought price-action is on both daily & weekly charts. If, Gold futures resume strength early on next week, however, this could represent a mere pause within the latest broad up-trend that could target 1450 once 1375 is fully cleared to the upside.
Crude oil futures gave back almost all of last week’s gains on Friday, highlighting another rejection by a declining trendline that’s been in place since February. Positioning by futures traders (into September 5th) inched up in terms of net long positions and percentage, as (gross) short positions dipped slightly after having leapt nearly 30% the previous week. The technical outlook remains confined to a well-established range between 45 & 50, and for the very near-term, range-bound conditions should persist unless the aforementioned trendline is broken to the upside.
E-mini S&P 500 futures continue to consolidate just below last months all-time high. Speculative sentiment (into September 5th) pulled back slightly as E-mini S&P 500 speculators covered gross longs quite substantially and covered gross shorts to a lesser extent. The net long percentage pulled back from fresh multi-year highs to suggest that large speculators are reducing exposure but remain relative optimistic going forward. It appears that price-action may be forming a potentially (bullish) continuation pattern. That said, a sustained loss of 100-day moving average support would indicate that a deeper correction is at hand.
Nasdaq 100 futures speculators mildly covered gross longs and reduced gross shorts in the latest COT report. This allowed for the net long percentage to inch up to 63% heading into the close of last Tuesday’s trade.Subsequent price-action suggests that technical headwinds such as weekly (chart) divergences may be potentially weighing. Moreover, the lethargic mood exhibited by non-commercial traders, hints of a struggle without some sort of (bullish) news event that can trigger technical separation from the August highs. That said, it would take a sustained loss (by Nasdaq 100 futures) of the 5800 region and/or 100-day moving average support to shift the overall trend lower.
US 10-Year futures prices have steadily risen, reaching new highs for the year just last week. The most recent COT data indicates, however, that (large) speculators are still not really participating into this latest bout of risk aversion. Net longs fell by over 61K contracts, pulling the overall percentage down to 57% from 59%, despite rising geopolitical tensions that have push (bond) yields to new (2017) lows. Although, the dominating theme of lower US dollar and US bond yields has yet to materially reverse, it is premature to call either a true breakout. In fact weekly technicals hint of basing by both the greenback and interest rates, but, unfortunately its also equally too early to call for a full-fledged recovery given how limited recent reversal have been.
US 30-year futures speculators optimism has stalled, according to the latest COT report, as bullish sentiment continued to pull-back off its 2017 high. Gross longs, however, remain near their highest level since 2008, while gross shorts increased by roughly 12K contracts. While the recent advance in price-action has been steady and choppy on its latest move back to the June peak at 157.80, the follow-through has been limited. The latest moves exhibited in sentiment coupled with a potential technical false-break could eventually steer US 30-year yields back towards 3.00%


Leave A Comment