
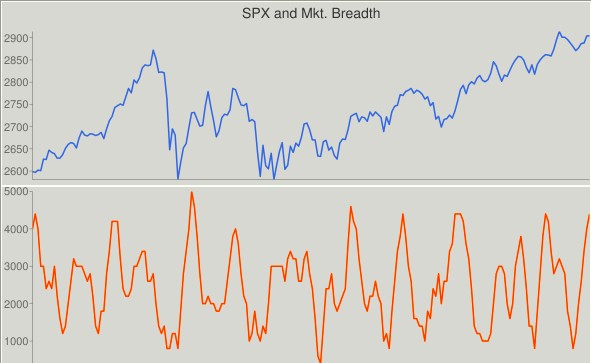
Once again, extreme market breadth levels, coupled with a CIT date proved to be a powerful mix resulting in a 40+ point SPX swing. That wasn’t enough, however, to propel the index to new highs, and the SPX stalled at the projected high target.
As a result, we’re stuck in a trading range. Since market breadth is currently overbought, betting on an immediate sustained breakout to new highs is a low odds play.
The last couple of weeks we focused on an easy way to insert price targets into your workflow. This week we’ll introduce a tool for unbiased and objective wave detection and monitoring.
Rather than being based on wishful thinking, subjective interpretation, or predetermined count quota and nomenclature, CIT Waves are grounded in strict rules and simple principles which can be summarized as follows: In an uptrend, bullish waves/swings should last longer and gain more points than bearish counter-trend waves/swings. The opposite is true for bearish waves /swings. As long as the length of directional swings is longer than the length of counter-trend swings, a directional movement/wave is in progress. You can use CIT Waves as a stand-alone indicator, or as a confirmation tool for your own wave count and analysis.
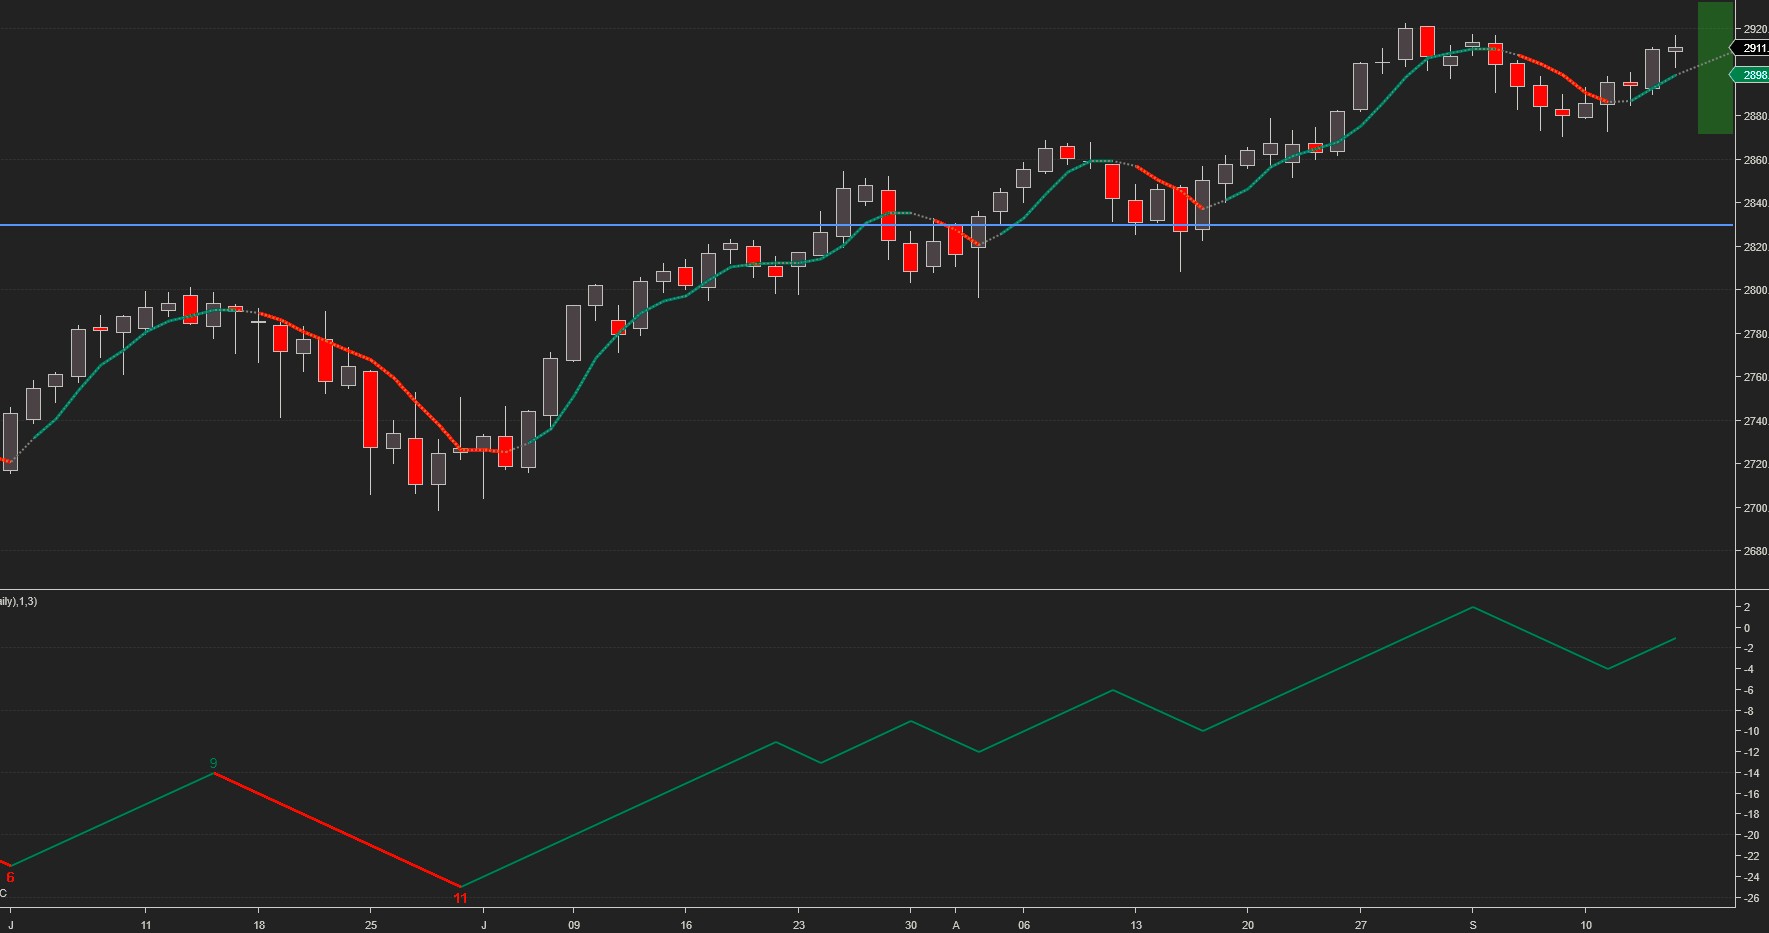
This abstract notion is best illustrated by the SPX chart below. Since the beginning of July, upswing duration and points gained have exceeded downswing duration and points lost, resulting in an uninterrupted bullish wave. If the current upswing fails to exceed 6 bars, however, this will signal that the bullish wave may be coming to an end.
The projected trading range for next week for SPX is 2870-2933:

Oil has been stuck in a $64 – $74 trading range since April 2018. Last week it reached and briefly exceeded our upside target only to pull back and finish in the middle of the projected trading range.
The projected trading range for oil for next week is 66.5 – 71.5.
Monthly pivots: P – 69.9, S1 – 67.5, S2 – 63.3, R1 – 72.3, R2 – 74


Leave A Comment