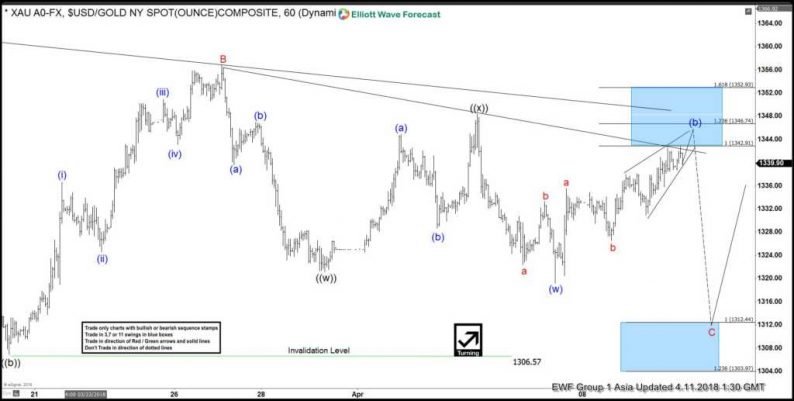
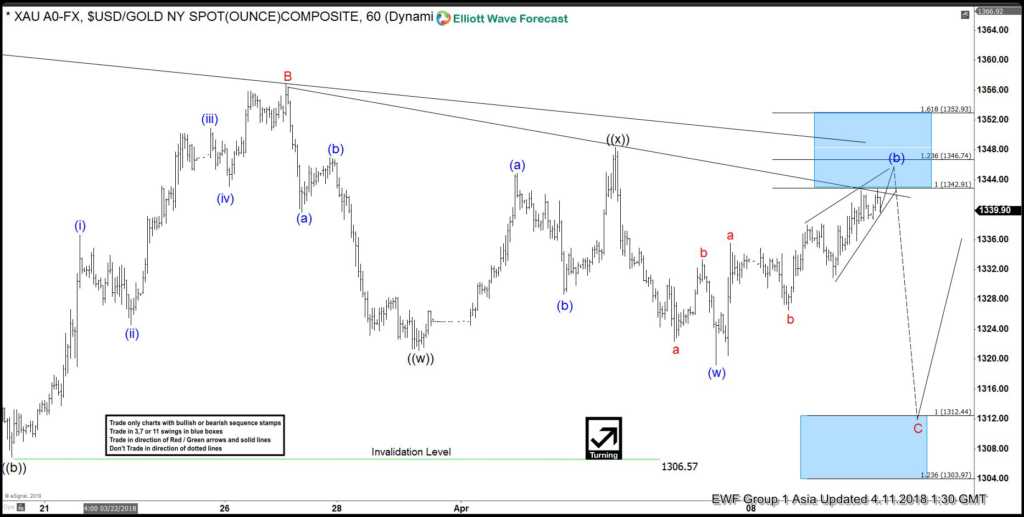
Gold short-term Elliott Wave view suggests that the yellow metal is in a sideways move, typical characteristic of a triangle Elliott Wave structure. A triangle is a sideways range structure with ABCDE label. In the case of Gold, decline from 1/25/2018 peak ($1366.06) ended in Minor wave A at $1302.6. Minor wave B bounce ended at $1356.83. Minor wave C is currently in progress and while bounces stay below $1356.83, the metal is expected to extend lower.
Internal of Minor wave C is unfolding as a double three Elliott Wave structure where Minute wave ((w)) ended at $1321.1, Minute wave ((x)) ended at $1348.4, and Minute wave ((y)) of C is in progress towards $1303.97 – $1312.44 before the metal turns higher and resume the consolidation. Near-term, expect Minutte wave (b) bounce to end at $1342.91 – $1346.74 area before the metal turns lower in 3 waves at least. Due to the sideways range, we prefer to stay on the sidelines waiting for break above $1366.06 or below $1302.6. The current view suggests that Gold is in a bullish triangle, thus it’s best to wait for a break above $1366.06 to signal the end of the triangle before looking to buy dips in 3, 7, or 11 swing.
Gold (XAUUSD) Elliott Wave 1 Hour Chart


Leave A Comment