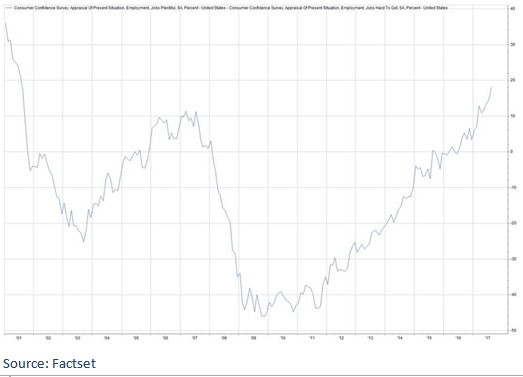
The chart below is blurry, but it still gets the job done in terms of showing you the most important trend in the labor market. The chart shows the spread between those finding jobs ‘plentiful’ vs ‘hard to get’ according to FactSet. As you can see, the ratio is above the level prior to the 2008 recession, but is below the level in 2001. The ultimate question policymakers are trying to answer is when the labor market is going to be overheated. There are some areas in manufacturing where businesses can’t find qualified workers. The question is when this situation spreads to more sectors in the economy. That will boost inflation, causing the Fed to raise rates. It will also cause margins to decline. Wage growth is important, but it will quickly get out of control, hurting the economy. It’s not great for businesses to be in a situation where they can’t find workers, so don’t think that high wage growth is nirvana. Nirvana is where we are now because the economy is in Goldilocks mode. It’s growing, but not in a way that’s causing too much inflation.

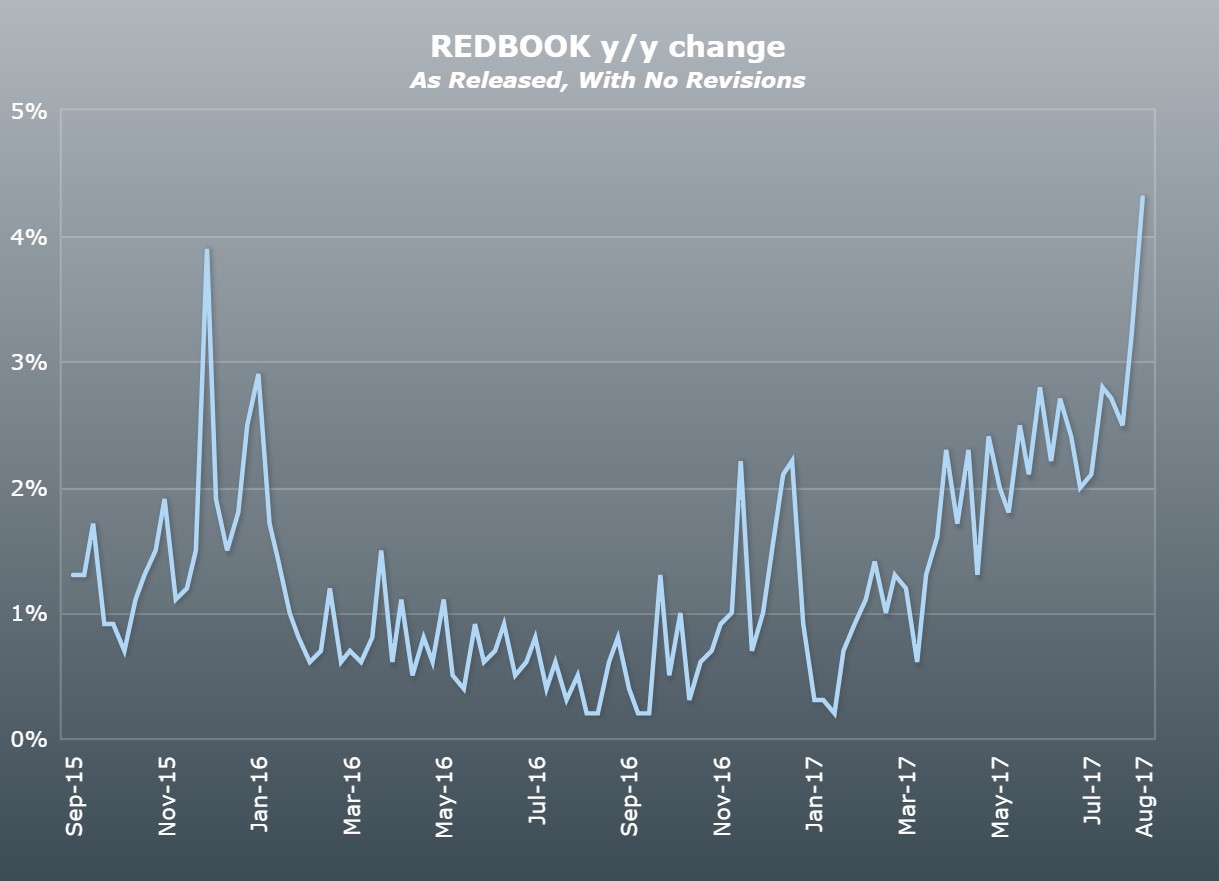
Now let’s look at some of the economic reports which were released Tuesday. The first report was Redbook which measures retail sales on a weekly basis. As you can see from the chart below, the same store sales growth in the August 26th week increased to 4.3% which is the fastest growth since June 2015. Month to date sales are up 0.2% which is the first positive reading in 8 weeks. August’s full month sales are up 3.2% which is the best growth rate in over 2-years. Clearly the retail environment is strong as workers begin to see wage growth.
The S&P CoreLogic Case Shiller Home Price index was also released Tuesday. The same trends are continuing. The market is tight as not enough houses are being built to fulfill demand. Housing prices were up 5.8% in June. As you can see from the chart below, the yearly growth has been steady while the month over month data vacillates wildly. Speaking of vacillating wildly, the Seattle housing market continues to see the fastest growth in the 20-city index. Seattle’s home prices were up 13.4%. I saw an infographic which showed the cities most and least likely to be hurt by a natural disaster. Seattle was one of the cities with the lowest risk of being hurt by a storm. Houston had high risk which unfortunately was realized this week. On the weak end of the price spectrum, Chicago, Cleveland, New York, and Atlanta came down. As I continue stress, the housing market is regional. It became correlated in the housing bubble and burst, but normally housing is based on local economies.


Leave A Comment