
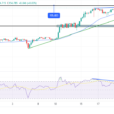
The Ethereum bull market is set to resume. Why do we think so? Very simply, cryptocurrencies in general have stopped their selloff right at secular support levels, and, Ethereum in particular, is doing so in a textbook fashion. The daily price chart of Ethereum embedded below makes the point.
In the last 12 months we have seen two very important advancements:
Note how two major peaks were set during period (1), both at the $390 price level making it secular resistance.
Note as well how the during period (2) the $390 resistance level got crushed though it took some time. The pattern of higher lows was suggesting it would happen, and we wrote about this extensively here, here and here.
There is one fundamentally important principle that applies to any market: when former resistance turns into support you have a confirmation that prices go higher.
Indeed, it’ is that simple, it only requires monitoring markets from a chart perspective in a disciplined way. We do not use news as a reference; as you can see not any news items is the basis for our forecast.
The way the cryptocurrency universe works, behaves, and, particularly, Ethereum’s chart, is the only basis for our forecast.
We are convinced crypto investors can become more aggressive now.
Remember we called the top on December 31, 2017 in this article Cryptoccurencies Setting A Major Intermediate Top?
Our call was spot-on, and we got this reaction from one of our loyal subscribers “It’s easier to wait and implement phased entries during this bull market, but it’s extremely hard to make a good exit, near the new all-time highs. It was hard but I did it based on your calls. I sold part of my crypto holdings around Jan 5, and the rest on Jan 15. Turned everything into stable coins, and started buying again after Feb 20.”


Leave A Comment