EUR/USD Elliott Wave Analysis in 15 Minutes chart
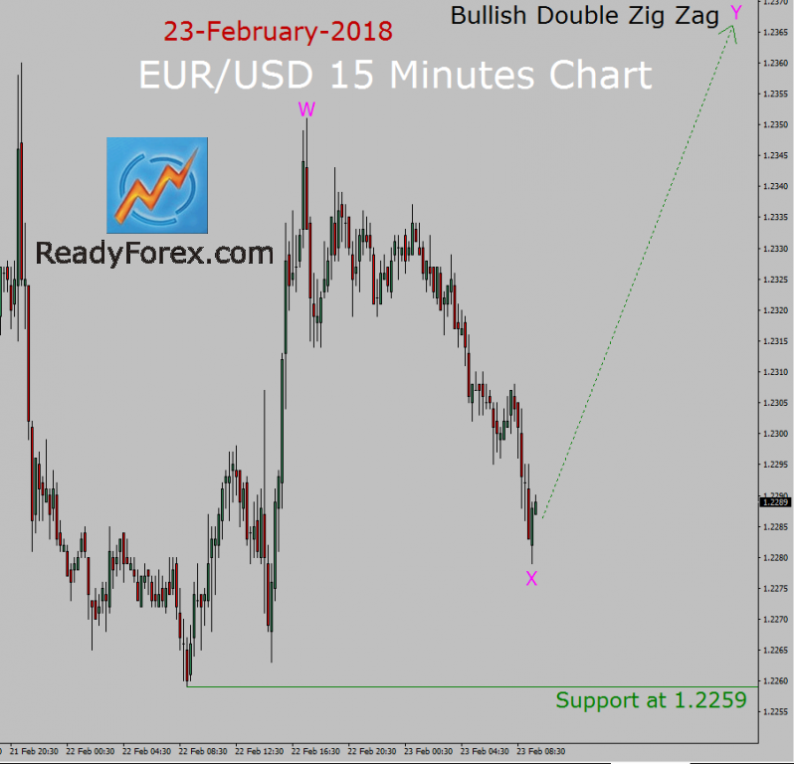
A bullish trend is present in EUR/USD currency pair, 15 minutes chart. The price of EUR/USD currency pair is going to rise up now on a short-term basis to create a Bullish Double Zig Zag corrective Elliott wave pattern and traders should consider taking a possible buy trading chance.
Strong key support level is present at 1.2259 price level which is the originating point of Bullish Impulse wave W leg. In my opinion, price action in EUR/USD currency pair has not completed bullish wave Y corrective Elliott wave pattern. So, based on Elliott wave analysis, Bullish corrective wave Y leg is going to move price up, towards 1.2365 price area in coming trading hours.
Next, price action is most likely going to print a short-term top as well in coming trading hours after completing bullish corrective wave Y pattern. As the trend is still bullish, Forex traders should consider only long trades and no trade against the current EUR/USD bullish trend as it is always easy to trade in the favour of market trend. Currently, bullish wave Y leg which is part of the Bullish Double Zig Zag Elliott wave pattern looks half finish. A good idea is to look for a possible buy trading chance to join an up trend around 1.2289 price area.
However; if the price action in EUR/USD spot Forex pair breaks below 1.2259 important support level then Bullish Elliott wave analysis will become in-valid. From this time forward, I may seize the opportunity to stay out of the market and re-assess the EUR/USD currency pair price movement in fifteen minutes chart.


Leave A Comment