The EUR/USD made a significant move to the upside and consolidated in the upper part of the 1.1700 handle. What’s next?
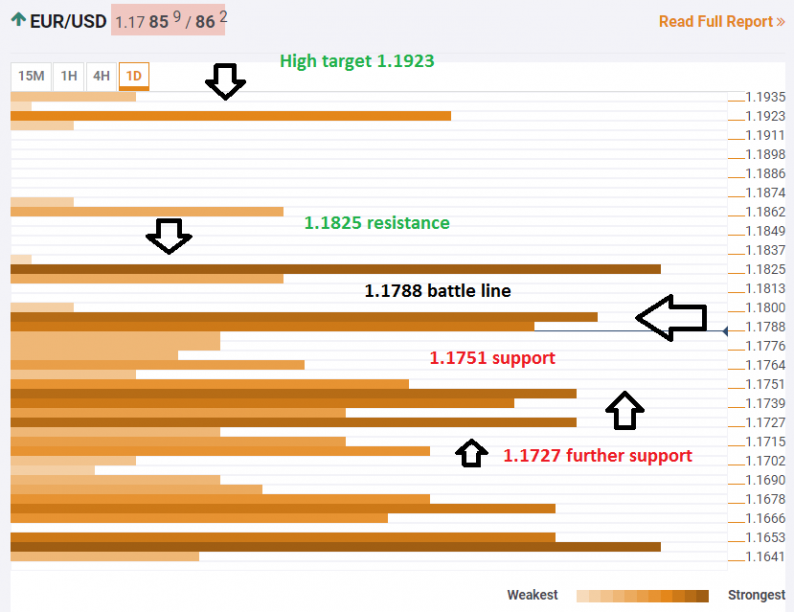
The Technical Confluences Indicator shows that the pair is currently battling the 1.1788 level. This is the convergence of the Pivot Point one-month Resistance 1, the Bolinger Band 4h-Upper, the BB 15m-Upper, the 4h high, and the 1h-high.
The next target on the upside is 1,1825 were we see the confluence of the Pivot Point one-day Resistance 1, the PP one-week Resistance 2, and the BB one-hour Upper.
A high target above is 1.1923 which is the Pivot Point one-week Resistance 3.
Looking down, support awaits at 1.1751 where we note a cluster that includes the Fibonacci 38.2% one-day, the BB one-day Upper, and the Simple Moving Average 100-15m.
The next cushion is close by 1.1727 is the convergence of the PP one-week R1, the SMA 10-4h, the SMA 200-15m, and lower, the Fibonacci 61.8% one-day.
Here is how it looks on the tool:

Confluence Detector
The Confluence Detector finds exciting opportunities using Technical Confluences. The TC is a tool to locate and point out those price levels where there is a congestion of indicators, moving averages, Fibonacci levels, Pivot Points, etc. Knowing where these congestion points are located is very useful for the trader, and can be used as a basis for different strategies.
This tool assigns a certain amount of “weight” to each indicator, and this “weight” can influence adjacents price levels. These weightings mean that one price level without any indicator or moving average but under the influence of two “strongly weighted” levels accumulate more resistance than their neighbors. In these cases, the tool signals resistance in apparently empty areas.


Leave A Comment