
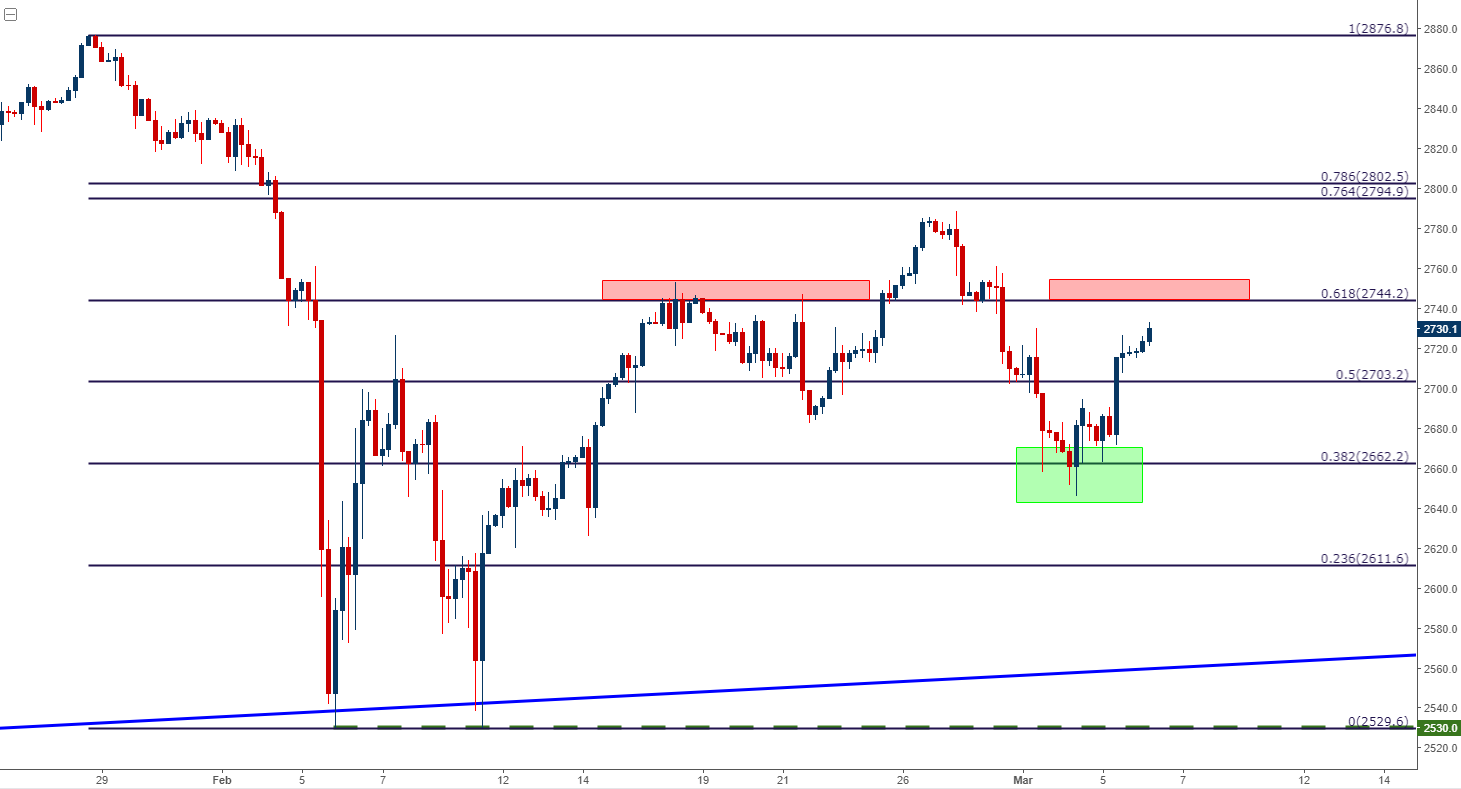
In what’s becoming a more regular occurrence, USD bears have come back while US equities have rallied. Last week produced a spate of strength in the US Dollar that saw DXY make a fast approach towards the 91.00 level; and this also brought pressure into US equities as stocks fell each day Tuesday-Thursday. But Thursday afternoon is around the time that ‘tariff talk’ came into the equation, and since then we’ve seen bears come back into the US Dollar while stocks have cauterized some support and moved back towards prior resistance. On the chart below, we’re looking at the S&P 500 after last week saw support settle around the 2662 level, which is the 38.2% retracement of the February sell-off in the index. The next level of resistance resides around 2750, as this was a prior group of swing-highs produced two weeks ago which set around the 61.8% retracement of the same Fibonacci study.
S&P 500 FOUR-HOUR CHART: FIBONACCI SUPPORT LEADS TO BOUNCE FROM LAST WEEK’S LOWS
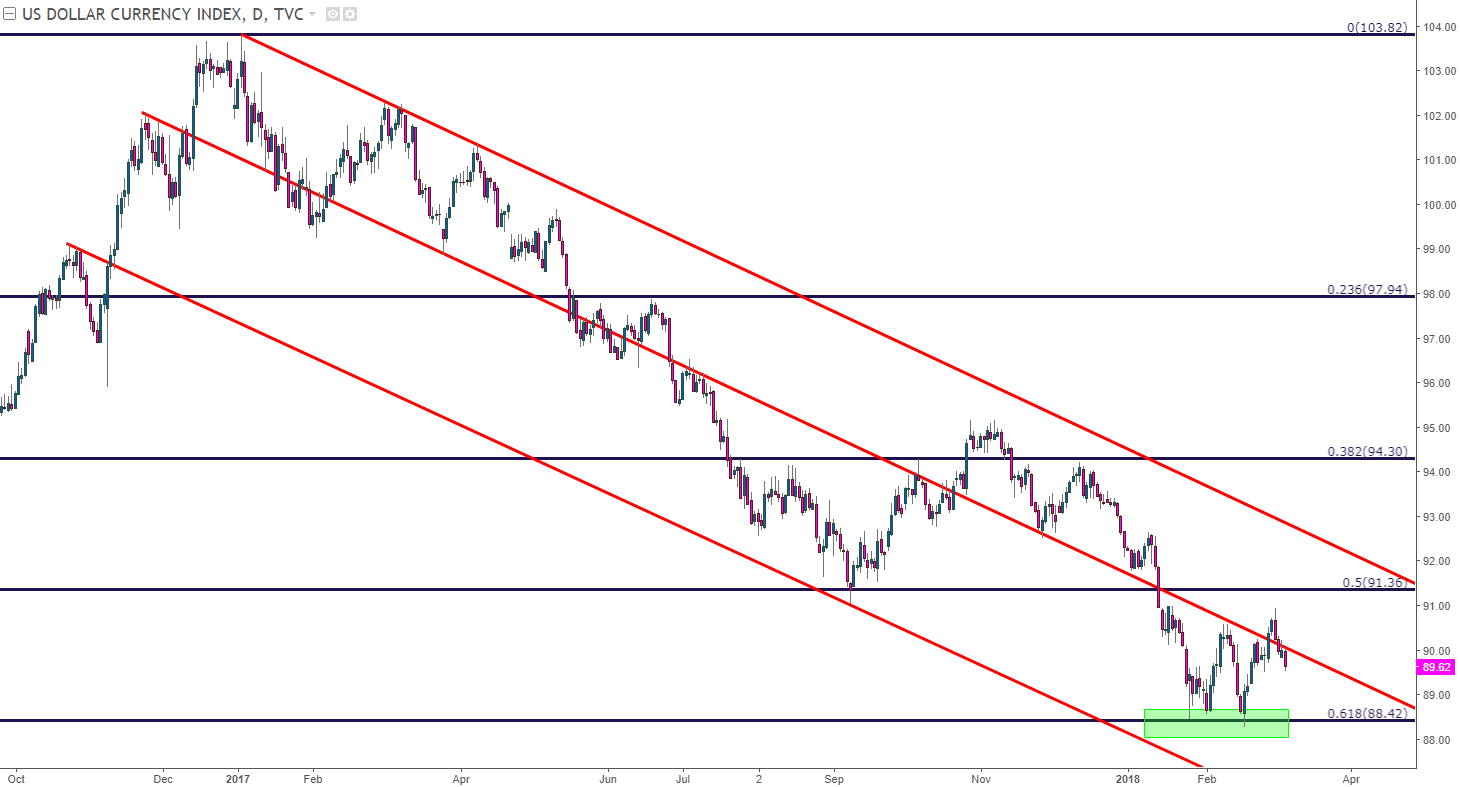
DOLLAR FALLS, DXY CROSSES BACK-BELOW 90.00 LEVEL
In the US Dollar, last week’s strength on the back of Day One of Mr. Powell’s testimony drove DXY back-above the 90.00 level. The Thursday-turnaround on the basis of taper talk saw the move pull back, and support held throughout yesterday as a short-term range had developed. But, even that could not hold as bears came back to push prices right back towards prior support around 89.50. This continues the Greenback’s rough and tumble 2018 after what was an aggressively bearish 2017.
US DOLLAR VIA ‘DXY’ DAILY CHART: BACK-BELOW 90.00, SELLERS REMAIN IN CONTROL
A HOT COAL OR A US TREASURY BOND?
The big question here is one of drivers, as such an extended move of weakness in a major currency, one that is being supported with a string of rate hikes no-less, will rarely put in such an extended drop. This is likely related to the continued rise in US Treasury Yields, which goes back to the Fed’s Quantitative Tightening along with a host of additional Treasury auctions in the next few years. The US Government is expanding to the tune of $500 Billion in extra spending over the next two years to go along with a Trillion worth of tax cuts over the next 10 years. Given that the US government runs at a deficit, this extra spending will need to be funded by debt. This means more supply of US government paper, which means lower prices and higher yields. This, when combined with the fact that the Fed is no longer actively accumulating Treasuries as part of QE and are actually going in the other direction by letting debt ‘roll off’ the balance sheet means that there’s also less demand.


Leave A Comment