
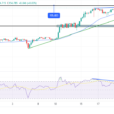
Let’s do a quick review of the Facebook (Nasdaq: FB) stock chart. After all that negative privacy news Facebook’s chart is peaking above a key support /resistance.
Let’s look. You see in the chart below we drew a line of key support/resistance. That’s the level where Facebook either broke out, held or broke down. It’s a key level.

When the stock dropped through that level it sliced much further. Now, pretty quickly Facebook’s stock has managed to get back up over that key level which is a bullish sign.
As you know we’re bullish and we still have we’re bullish numbers.It’s nice when the fundamentals and technicals can agree. As we move up and away from this key level you can have more confidence that Facebook has weathered the negative news and can start moving back up hopefully based on strong earnings fundamentals.
Facebook reports April 25th after the close.


Leave A Comment