
The BLS Job Openings and Labor Turnover Survey (JOLTS) can be used as a predictor of future jobs growth, and the predictive elements show that the year-over-year growth rate of unadjusted private non-farm job openings declined from last month. The growth rate trends marginally decelerated in the 3 month averages.

There was no market expectations published by Bloomberg this month.

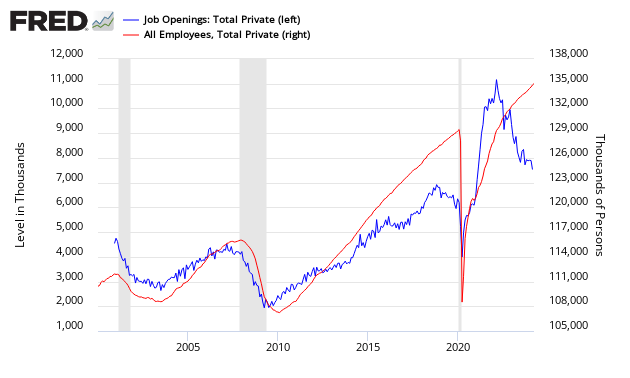
The relevance of JOLTS to future employment is obvious from the graphic below which shows JOLTS Job Openings leading or coincident to private non-farm employment. JOLTS job openings are a good predictor of jobs growth turning points.
Seasonally Adjusted Private Jobs Openings from JOLTS (blue line, left axis) compared to BLS Non-farm Private (red line, right axis)
The graph below uses year-over year growth comparisons of non-seasonally adjusted non-farm private BLS data versus JOLTS Job Openings – and then compare trend lines.
Year-over-Year Change – Seasonally Jobs Openings from JOLTS (blue line, left axis) compared to Unadjusted BLS Non-farm Private (red line, right axis)

Seasonally Adjusted Hires (blue line) and Seasonally Adjusted Separation Levels (red line) – Non-Farm Private

Please note that Econintersect has not been able use the hire rate or the separation rate (or a combination thereof) to help in understanding future jobs growth. A Philly Fed study agrees with Econintersect’s assessment. JOLTS is issued a month later than the jobs data – and correlates against one month old data. The data in the below chart shows that the JOLTS data is turning at the same points – but the JOLTS data is released one month later making this a lagging indicator.


Leave A Comment