
EUR/USD
4 hour

The EUR/USD bounced at the support trend line (green) one more time to expand the sizeable correction within wave Y (purple) of wave 2 (brown). The wave 2 (brown) becomes invalidated if price manages to break above the top at 1.1425 whereas wave 3 (green) could start if price manages to break below support (green line).
1 hour

The EUR/USD showed a bullish bounce at the 61.8% Fibonacci level of wave X (blue) as expected in yesterday’s wave analysis. A new ABC (green) zigzag seems to be unfolding within the larger corrective pattern.
GBP/USD
4 hour
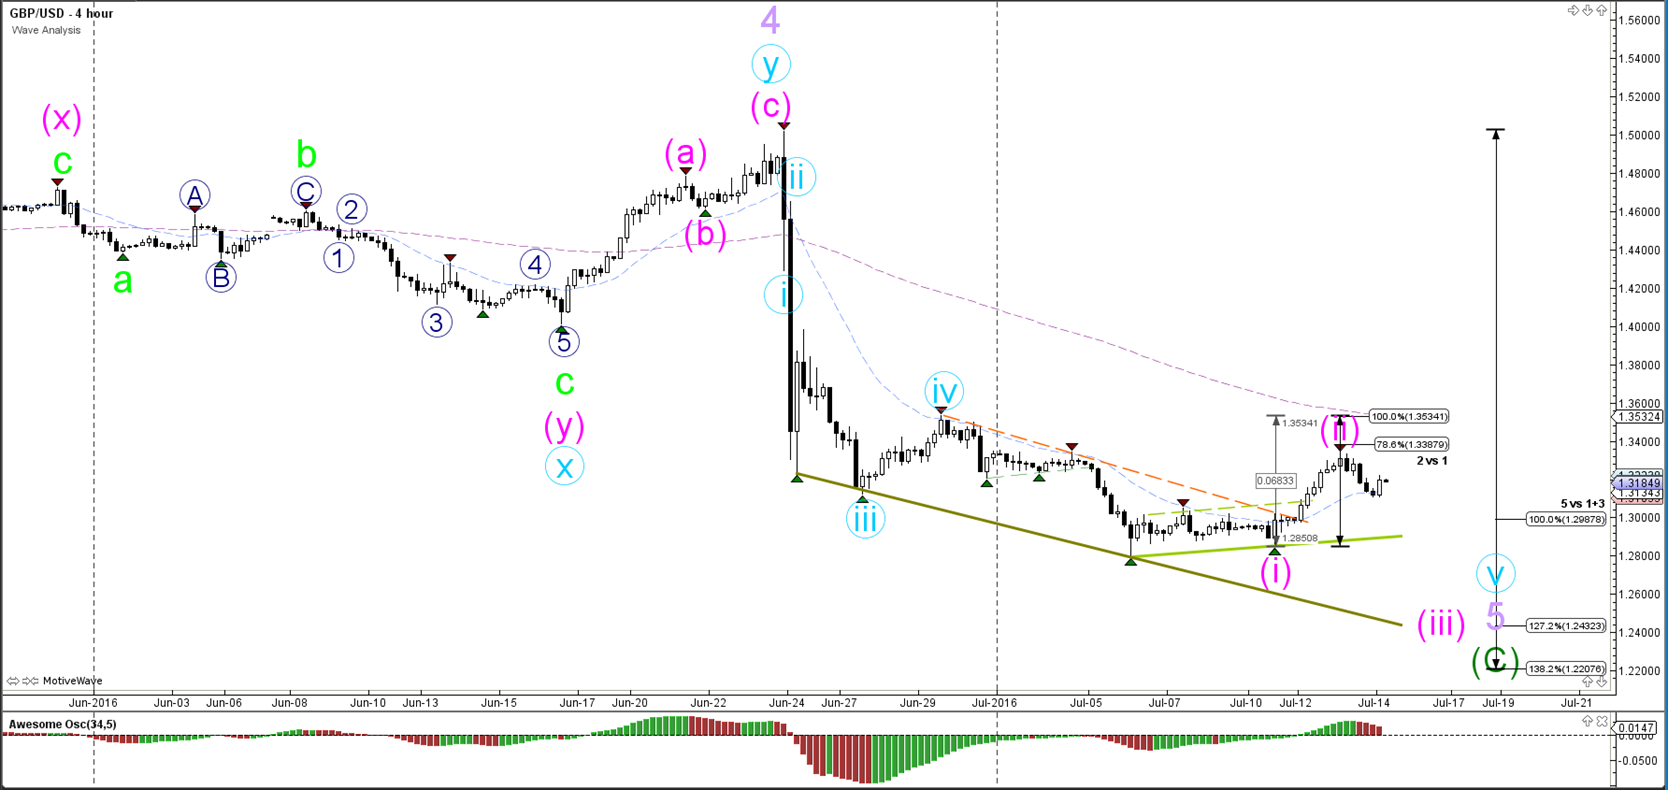
The GBP/USD respected the deep 78.6% Fibonacci level of wave 2 (pink). A break above the 100% level of ‘2 vs 1’ invalidates the wave 1-2 (pink). A break below the support trend line (green) would most likely confirm the start of wave 3 (pink). The GBP wave count is highly dependent on the Bank of England (BOE) interest rate decision, its monetary policy statement, and speech from the BOE Carney during the upcoming days.
1 hour
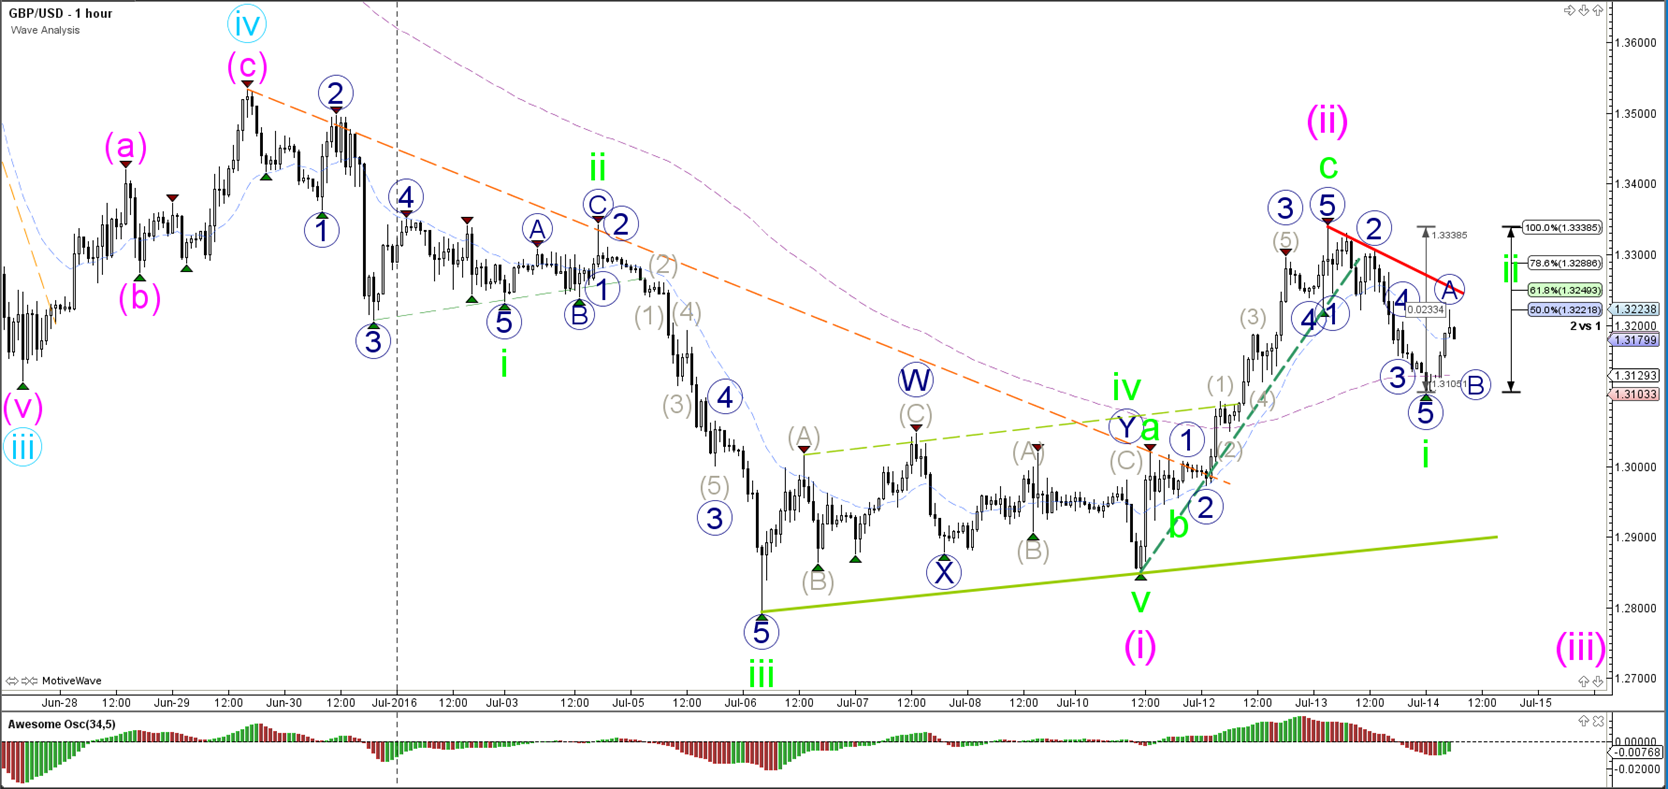
The GBP/USD broke the support level (dotted green) of the bullish channel. The bearish decline after the break seems to have unfolded in 5 waves (blue) to build a wave 1 (blue). A break of the 100% Fibonacci level of wave ‘2 vs 1’ invalidates the wave 2 (green).
USD/JPY
4 hour
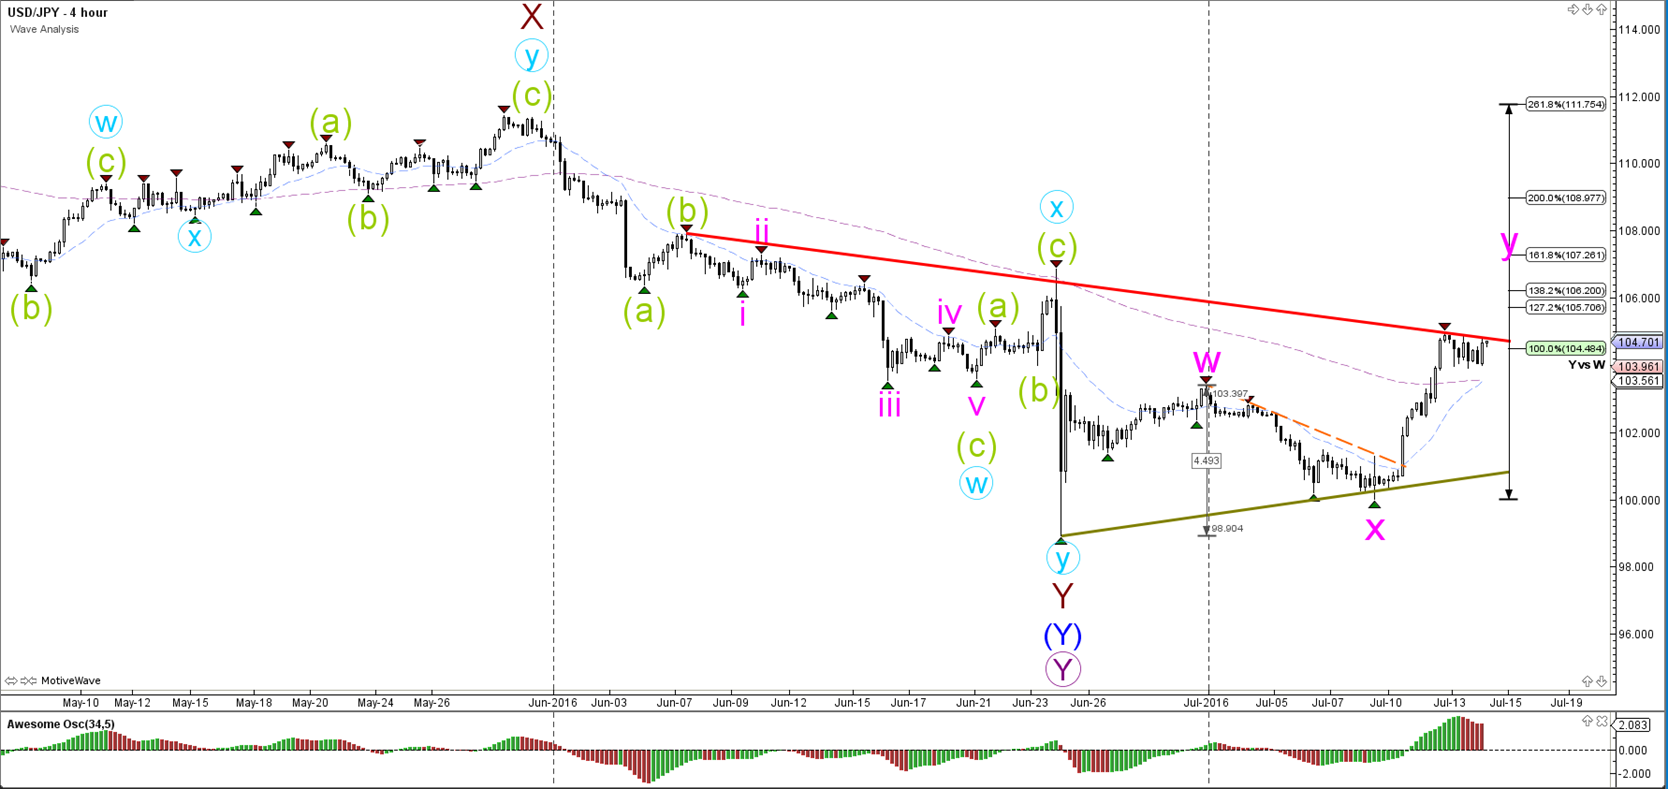
The USD/JPY is continuing to test the resistance trend line (red). At the moment price seems to be pausing at the 100% Fibonacci level as well. A bullish break above the trend line (red) could see price test higher Fib levels. A break above the 161.8% target would indicate a bullish reversal and a change of the wave count from WXY (pink) to a 123.
1 hour

The USD/JPY sideways movement seems to be unfolding in a bull flag chart pattern (red/green lines) which is respecting the 23.6% Fibonacci level. A break above the bull flag could spark the start of wave 5 (orange). A break below the flag could see price move to and bounce at the 38.2% Fibonacci support.


Leave A Comment