
AUD/USD Daily Chart
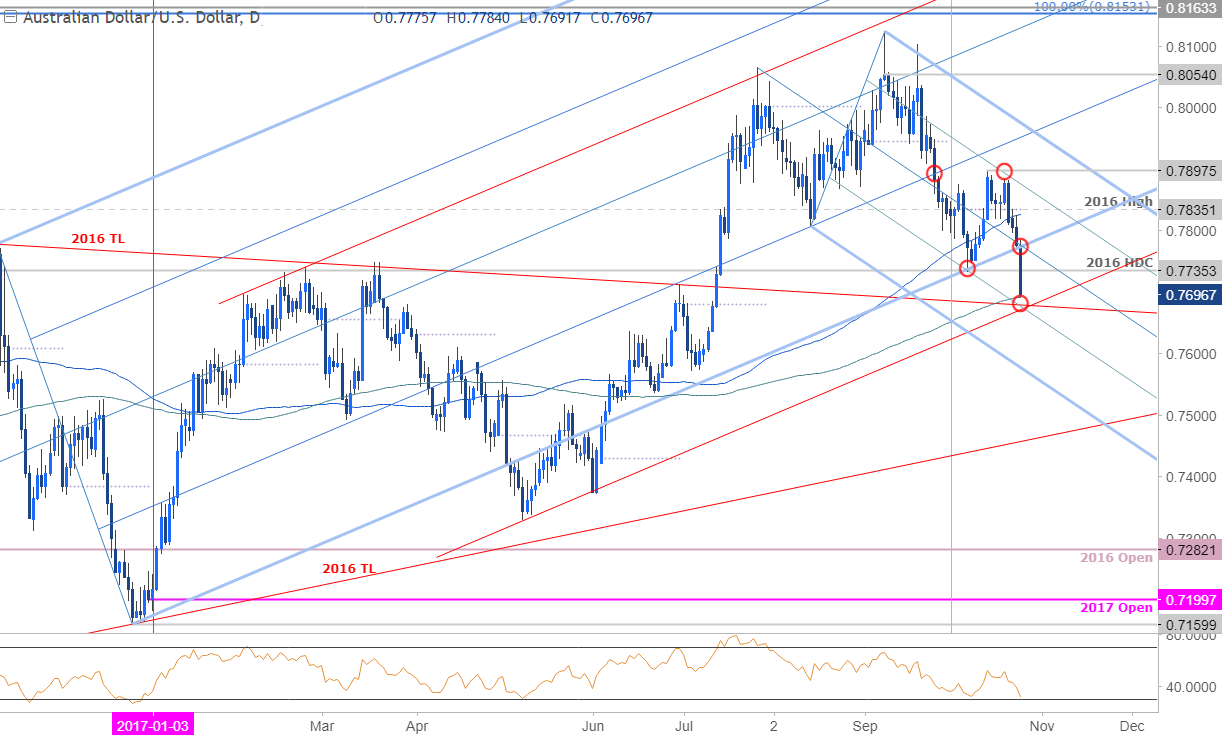
Technical Outlook: Aussie broke below confluence slope support at ~7778 last night on the heels of a lackluster print on 3Q CPI. The decline is now targeting a critical support confluence highlighted in yesterday’s weekly technical perspective at 7630/65. A break below this mark risks substantial losses for the pair with such a scenario eyeing the lower median-line parallel, currently ~7570s.
AUD/USD 240min
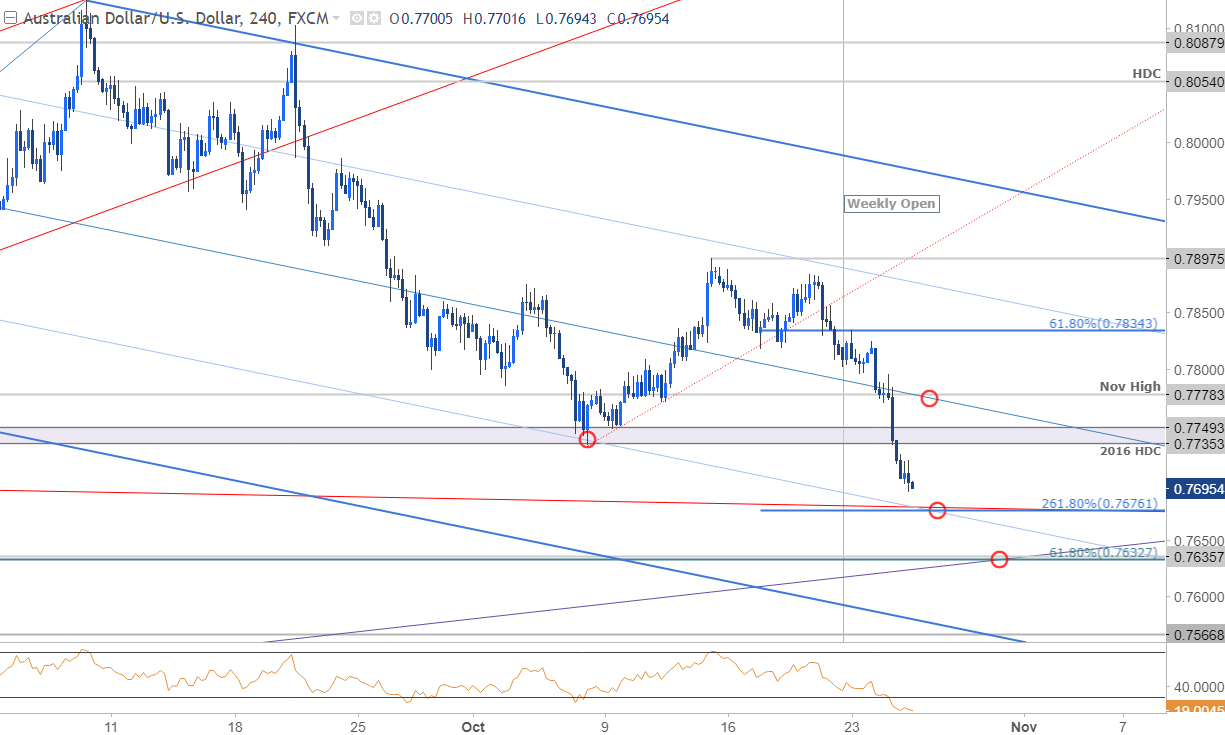
Notes: A closer look at price action highlights AUDUSD trading within the confines of a descending pitchfork formation extending off the yearly highs. Note that the lower 50-line (blue) converges on yearly slope support (red) around 7675 with the 61.8% retracement of the May advance just lower at 7632– an area of interest for possible exhaustion / long-entries.
Interim resistance now stands at 7750 with our immediate focus lower while below the median-line / November highs at ~7778. Bottom line: looking lower for a reaction at critical long-term support for a possible near-term recovery in price. Added caution is warranted heading into the close of the week with the release of US 3Q GDP figures likely to fuel increased volatility in the USD crosses.


Leave A Comment