The EMFM ETF from Global X is an interesting choice for investors as it offers exposure to the next emerging markets and frontier markets. We have written extensively about our bullish outlook for emerging markets. For investors willing to take the extra risk, frontier markets could be an interesting option.
Note that frontier stock markets started to look bullish and started outperforming U.S. markets several months ago. Even Reuters noticed this trend in this article which appeared in May: “Frontier stock markets draw fresh look as U.S. shares get frothy“:
“It’s very similar to emerging markets 15 years ago,” said Chad Cleaver, lead portfolio manager at Driehaus Frontier Markets Strategy. “These are basic industries that happen to be heavily underpenetrated.”
After years of sub-par returns, frontier markets started 2017 strong and are getting fresh looks as U.S. valuations look steep and emerging markets have been on an explosive run.
InvestingHaven’s research team noticed some similar trends early this year though it was not only focused on frontier stock markets: Global Stock Markets Are Outperforming U.S. Stock Markets In 2017.
Guess what? Frontier stock markets continue to look great, and could be setting up for a meaningful breakout.
What is a frontier stock market?
According to Wikipedia, A frontier market is a type of developing country which is more developed than the least developing countries, but too small to be generally considered an emerging market.
This sums up nicely why FM Markets come with a higher risk.
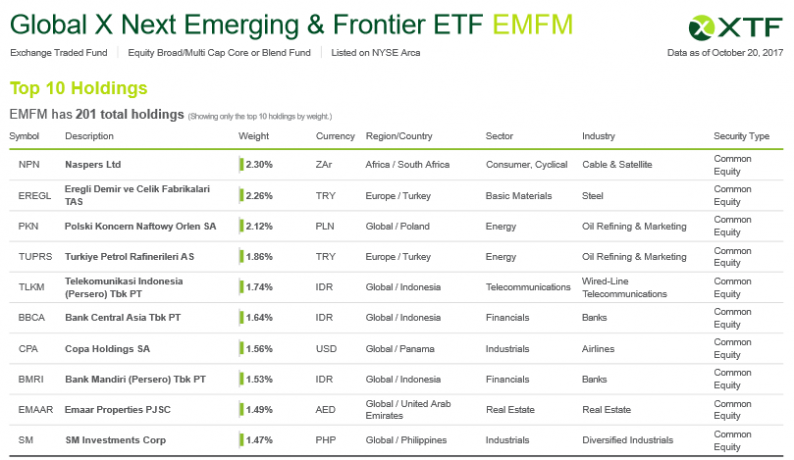
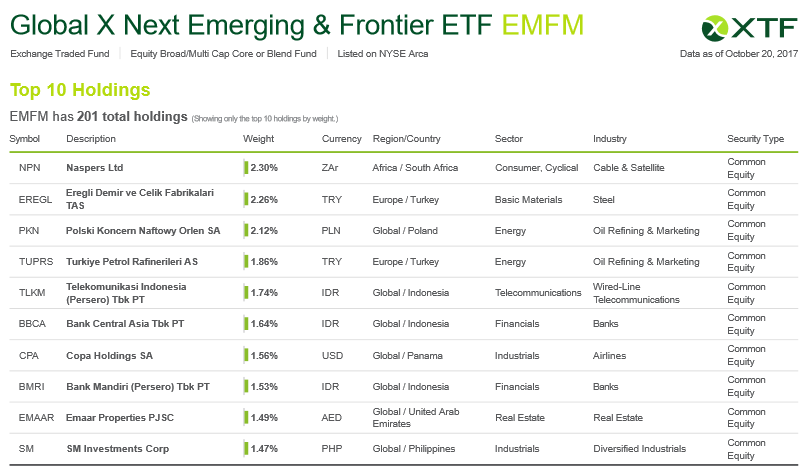
In terms of holdings, the ETF has 30% of its holdings in Asia, 24% in Europe and 17% in Latin America.
Global X EMFM Chart Set Up
The chart below illustrates both the US 10 Years Treasury Yield TNX and Global X’s EMFM. Based on the chart we can observe the following:


Leave A Comment