
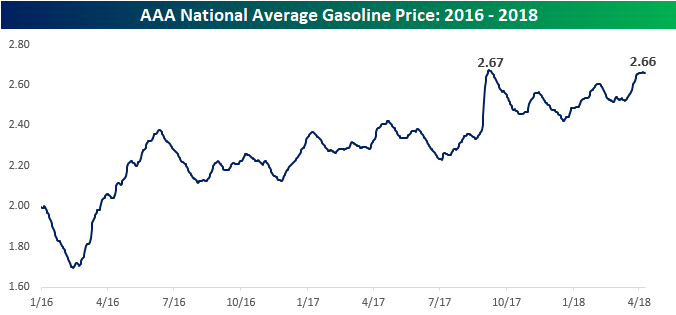
With all of the concern over inflation recently, nowhere do rising prices hit closer to home than at the gas pump (unless you’re driving a Tesla of course), and as you might expect given that crude oil prices are in the mid-60s, prices at the pump have been on the rise. According to AAA, the national average price currently stands at $2.66 per gallon, which is just off the $2.67 post-crash high that we saw late last summer in the aftermath of the hurricanes.
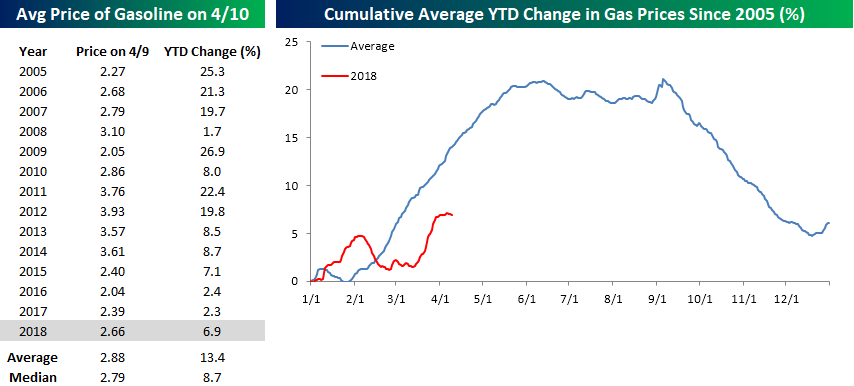
While prices have been on the rise this year, the magnitude of the move has hardly been out of the ordinary for this time of year. The table to the lower right shows the YTD change (through 4/9) for the national average price of a gallon of gas going back to 2005. While prices are up 6.9% this year, that’s actually only slightly more than half the average YTD change of 13.4% as of early April and nearly a full two percentage points below the median change of 8.7%. In the lower right chart, we have created a composite chart of the average price of gasoline throughout the year. As shown, it’s very common for gas prices to rise in the first three months of the year. In fact, there hasn’t been a single year since 2005 that the national average price was down YTD through 4/9, and this year’s 6.9% gain is the fourth smallest YTD gain of the fourteen years.
Based on historical trends, we’re also only about two months from the point in the year where gas prices typically peak (mid-June). From that point through the Summer, prices typically level off before plummetting to close out the year.


Leave A Comment