GBP/USD
4 hour

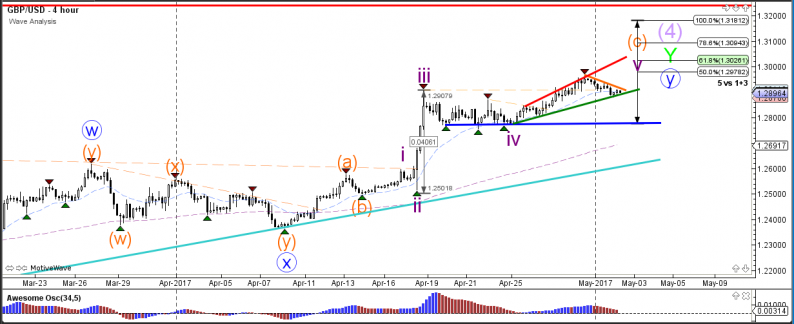
The GBP/USD is building a contracting triangle chart pattern within a trend channel (red/green) which is taking place in wave C (orange). A bounce at the support trend line (green) could see price continue towards the Fibonacci targets of wave 5 (purple) whereas a break below support (green) could see price correct back to the previous support (blue).
1 hour
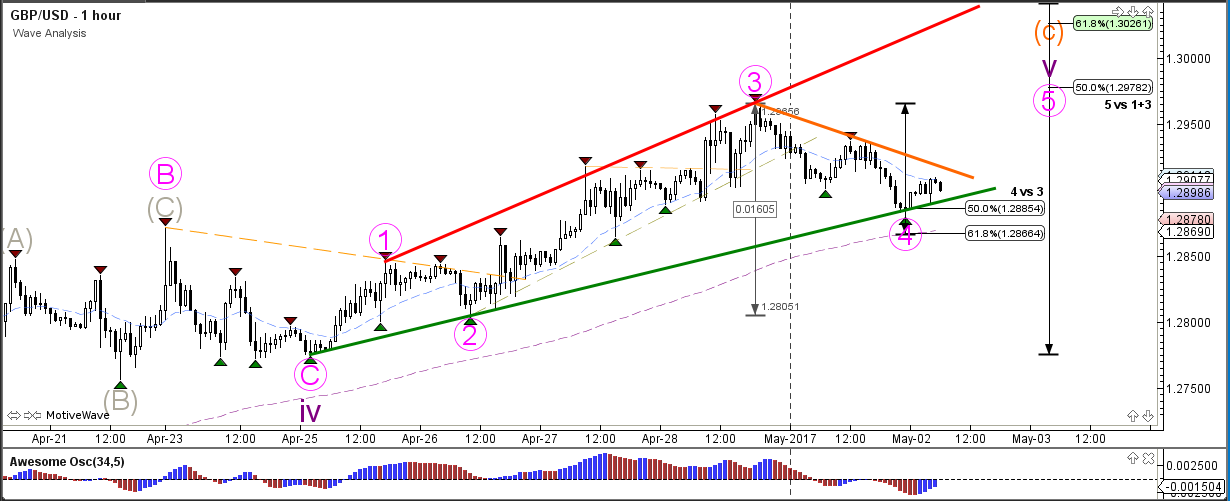
The GBP/USD has retraced back to the 50% Fibonacci level of wave 4 (pink), which could be confirmed if price breaks above resistance (red) and invalidated if price breaks below the 61.8% Fibonacci level.
EUR/USD
4 hour

The EUR/USD is in a consolidation pattern which is best indicated by the support (blue) and resistance (red) trend lines. A bullish break above resistance (red) would indicate a potential uptrend continuation towards the 78.6% Fibonacci level of wave 2 (green) whereas a bearish break could start a reversal and indicate the completion of the ABC zigzag (purple).
1 hour
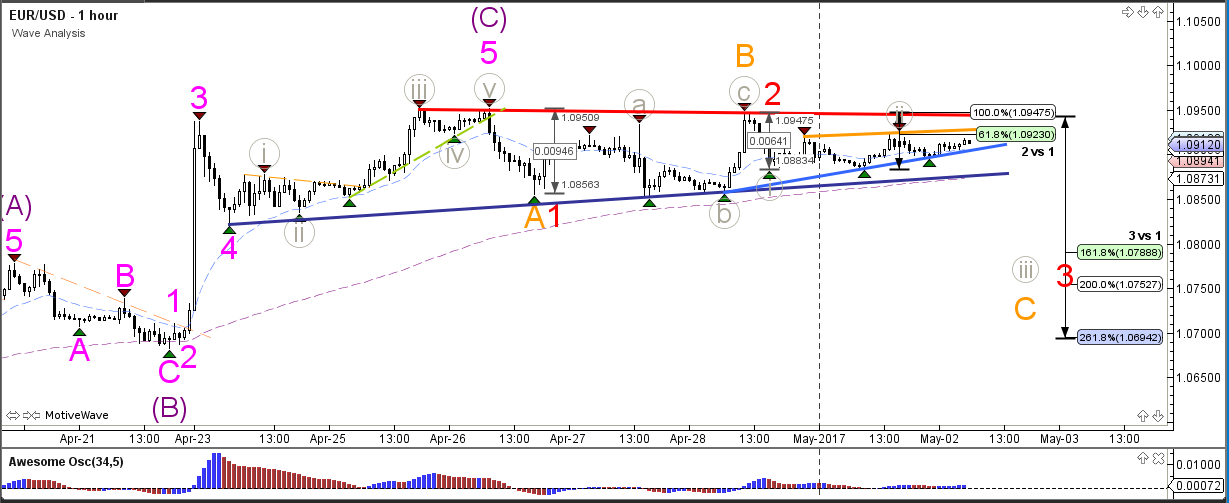
The EUR/USD reversal or retracement pattern is invalidated if price manages to break above the resistance trend lines (red/orange). A larger reversal or correction could take place if price breaks below the support trend lines (blue).
USD/JPY
4 hour

The USD/JPY has completed the wave 4 (brown) correction at the support trend line (green) and is now continuing towards the Fibonacci targets of wave 5 (brown).
1 hour
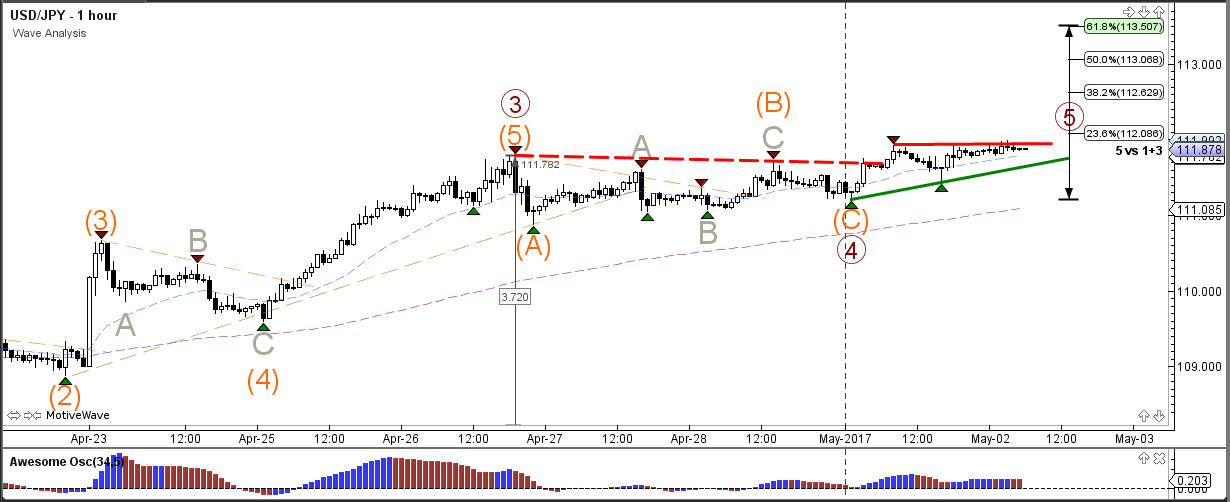
The USD/JPY broke the contracting triangle (dotted red) chart pattern and a bullish breakout is developing within a wave 5 (brown). A new resistance level (red) needs to be broken before the wave 5 (brown) can continue.





Leave A Comment