The gold to silver ratio moved up very sharply this week, +4.2%. How did this happen? It was not because of a move in the price of gold, which barely budged this week. It was due entirely to silver being repriced 66 cents lower.
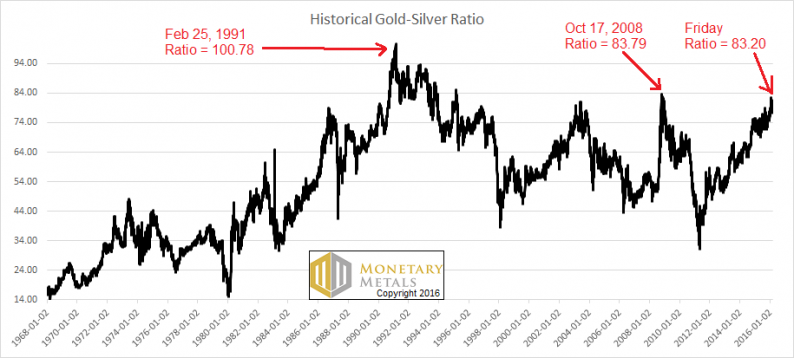
This ratio is now 83.2. It takes 83.2 ounces of silver to buy an ounce of gold. Conversely, it takes 1/83.2oz (about 0.37 grams) of gold to buy an ounce of silver.
This ratio is now within a hair’s breadth of breaking out past the high set on Oct 17, 2008. See the historical graph (based on LBMA silver fix and PM gold fix data, provided by Quandl).
The Historical Ratio of the Gold Price to the Silver Price

Monetary Metals has been predicting a ratio well over 80 for a long time. And for two months, we have been calling for it to go much higher still. Could there be a correction? Absolutely. Could the fundamentals change? We expect they will—at some point. We will call that when we see it.
Speaking of the fundamentals, read on for the only true picture of the gold and silver supply and demand fundamentals…
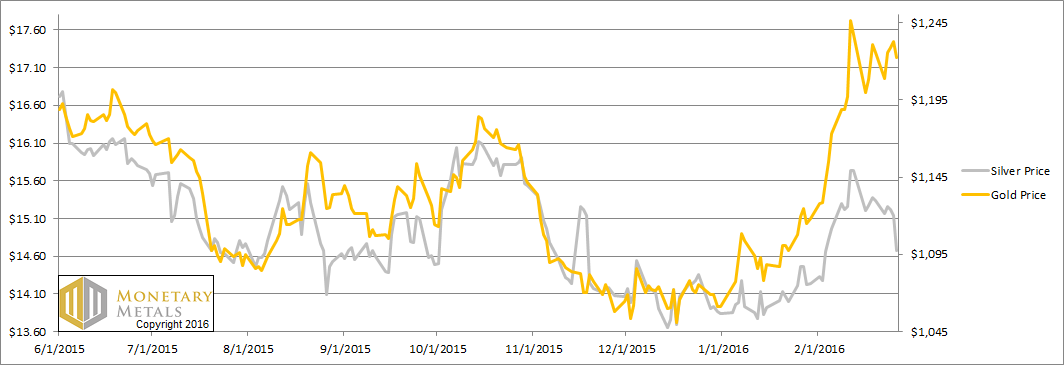
But first, here’s the graph of the metals’ prices.
The Prices of Gold and Silver
We are interested in the changing equilibrium created when some market participants are accumulating hoards and others are dishoarding. Of course, what makes it exciting is that speculators can (temporarily) exaggerate or fight against the trend. The speculators are often acting on rumors, technical analysis, or partial data about flows into or out of one corner of the market. That kind of information can’t tell them whether the globe, on net, is hoarding or dishoarding.
One could point out that gold does not, on net, go into or out of anything. Yes, that is true. But it can come out of hoards and into carry trades. That is what we study. The gold basis tells us about this dynamic.
Conventional techniques for analyzing supply and demand are inapplicable to gold and silver, because the monetary metals have such high inventories. In normal commodities, inventories divided by annual production (stocks to flows) can be measured in months. The world just does not keep much inventory in wheat or oil.
With gold and silver, stocks to flows is measured in decades. Every ounce of those massive stockpiles is potential supply. Everyone on the planet is potential demand. At the right price, and under the right conditions. Looking at incremental changes in mine output or electronic manufacturing is not helpful to predict the future prices of the metals. For an introduction and guide to our concepts and theory, click here.


Leave A Comment