
Today’s chart 2-pack takes a broad look at Gold and U.S. Equities. Both assets appear destined for a resolution soon. Could they be headed in opposite directions?
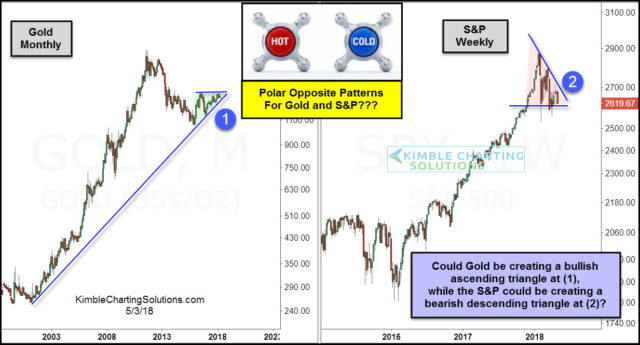
Perhaps so… if these technical patterns play out according to the script. In the 2-pack below, we have a “monthly” bar chart for Gold and a “weekly” bar chart for the S&P 500 Index.
In the Gold chart, we have a bullish ascending triangle (point 1) and in the S&P 500 chart, we have a bearish descending triangle (point 2).
These are long-term charts, so the resolution of these patterns will likely be important to investors. For Gold’s pattern to trigger a bullish signal, it would need to breakout over the resistance line of the wedge. And for the S&P 500’s pattern to trigger a bearish signal, it would need to break down below its lower support line.
CLICK ON CHART TO ENLARGE
These patterns provide guideposts for investors. Although they tend to be bullish/bearish, they can go in either direction. For instance, the ascending wedge pattern for Gold would fail if it breaks the lower trend line. And the descending wedge pattern for the S&P 500 would fail if it breaks the upper falling trend line.
Stay tuned, as the moves out of these patterns should be large and provide sizeable opportunities!


Leave A Comment