“Seasonally, on average, the index highs have come between mid April and early May during the 2nd year of the Presidential Cycle. It seems unlikely we will see new index highs in the next month, but a significant rally is possible.” Mike Burk, March 24, 2018
The market has punished us this week for being too complacent, and it is washing out our excess bullishness. It sounds almost religious.
Even those of us who follow sentiment and know that it is a contrary indicator… we still get swept in the euphoria and the FOMO.
I read on Twitter this week that often our worst trades come after our best trades because we let our guard down. So true, and this year so far has been a perfect example.
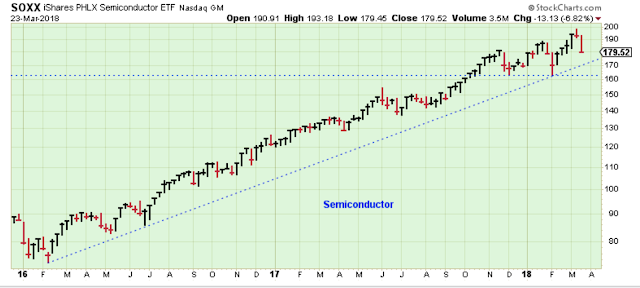
This bull market has been led higher by Technology, so I think it is an important indicator to consider regarding the health of the market overall.
This chart looks healthy, and that means it continues to favor higher stock prices.

The banks are very sensitive to short-term rates, so any weakness in this chart calls into question the assumption of higher short-term rates. And a healthy economy assumes gradually higher short-term rates, etc.
This chart is a bit of a concern, and it needs to hold at the shelf support.

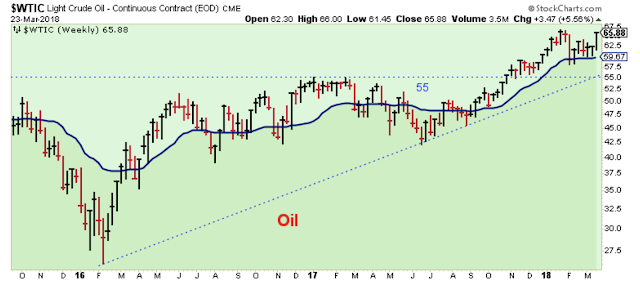
The chart below helps reassure that short-term rates will continue higher. Strong oil prices are sure to be followed by rising rates. I like the looks of this, and it makes me think that we might get a very nice snap back rally in the banks when the mood of the market swings back in favor of stocks.
I am still feeling the sting of being so wrong to think that new highs for the NDX would pull the overall market higher last month. I should have consulted this chart beforehand.
This Dow test of its 200-day looks inevitable from the view of this chart. The Dow moved too high, too fast, and it had to crack at some point.
Now we are looking for the diffusion indicator to move back up above its zero-line.


Leave A Comment