Retail sales marginally declined according to US Census headline data. Our view is that this month’s data was stronger than last month. There was an improvement of the rolling averages. Consider that the headline data is not inflation adjusted and prices are currently deflating making the data better than it seems.

Backward data revisions were generally upward.
Econintersect Analysis:
unadjusted sales rate of growth accelerated 1.0 % month-over-month, and up2.8 % year-over-year.
unadjusted sales 3 month rolling year-over-year average growth accelerated0.2 % month-over-month, 2.1 % year-over-year.
Advance Retail Sales Year-over-Year Change – Unadjusted (blue line), Unadjusted with Inflation Adjustment (red line), and 3 Month Rolling Average of Unadjusted (yellow line)

/images/z retail1.png
unadjusted sales (but inflation adjusted) up 3.7 % year-over-year
this is an advance report. Please see caveats below showing variations between the advance report and the “final”.
in the seasonally adjusted data – furniture, building materials, sporting goods, and food services were strong, but mostly everything else was soft.
U.S. Census Headlines:
seasonally adjusted sales down 0.1 % month-over-month, up 2.1 % year-over-year (last month was 1.7 % year-over-year).
the market was expecting (from Bloomberg):
| seasonally adjusted |
Consensus Range |
Consensus |
Actual |
| Retail Sales – M/M change |
-0.4 % to 0.3 % |
+0.0 % |
-0.1 % |
| Retail Sales less autos – M/M change |
0.0 % to 0.7 % |
+0.2 % |
-0.1 % |
| Less Autos & Gas – M/M Change |
0.2 % to 1.0 % |
+0.3 % |
+0.0 % |
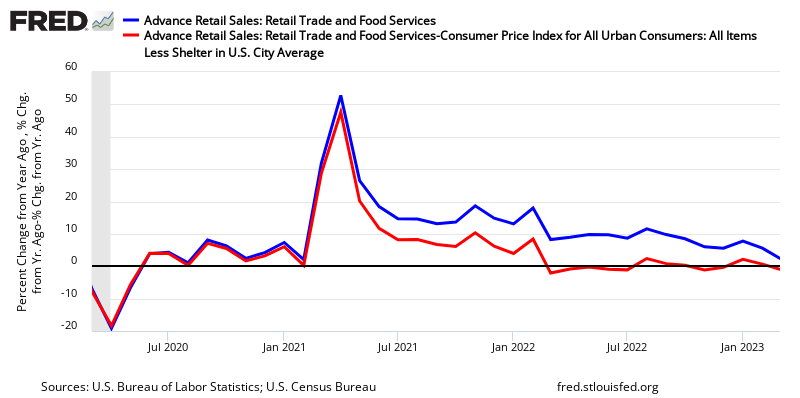
Year-over-Year Change – Unadjusted Retail Sales (blue line) and Inflation Adjusted Retail Sales (red line)

Retail sales per capita seems to be in a long term downtrend (but short term trends vary depending on periods selected – see graph below).


Leave A Comment