
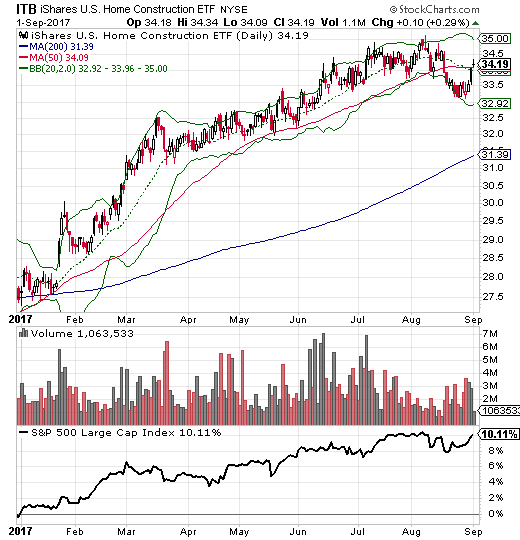
The last Housing Market Review covered data reported in July, 2017 for June, 2017. The month from there marked a significant change in tone for home builders. The change in tone starts with the iShares U.S. Home Construction ETF (ITB) and its failure to hold support at its 50-day moving average (DMA) for the first time since its last such breakdown a year ago. Indeed, part of the seasonal trade in home builders revolves around changes in the summer. Various charts on home builders have me on alert for a more significant sell-off ahead.
Source: StockCharts
The iShares U.S. Home Construction ETF finally broke down below support at its 50DMA. It ended the week with the barest of recoveries. Can this hold?(Note the bottom of the chart shows ITB’s performance relative to the S&P 500 (SPY) from the beginning of the chart).
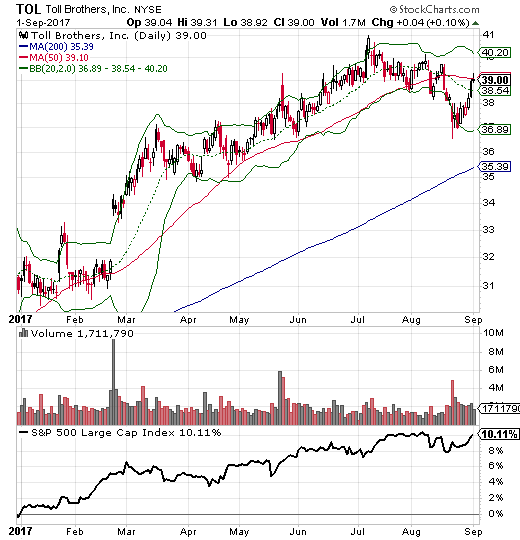
One key highlight of the month for me was the poor post-earnings reaction to Toll Brothers (TOL). Last month, TOL almost became a lowlight. Shortly after the last Housing Market Review, TOL broke down below its 50DMA two more times. I finally had enough and sold on the second breakdown and ahead of earnings. That sale seemed validated by the poor response to earnings. Yet, TOL ended the week with a full post-earnings recovery and a retest of its 50DMA. Still, I will not venture back until the seasonal trade on home builders revs back up in October or November.
Source: StockCharts
Toll Brothers is suddenly struggling to hold onto 50DMA support.
Another highlight was the spectacular post-earnings performance of Invitation Homes (INVH). I have touted this company and its stock since its IPO. INVH is now up about 16% from its IPO this year. (Chart not shown due to dysfunction in charting tools).
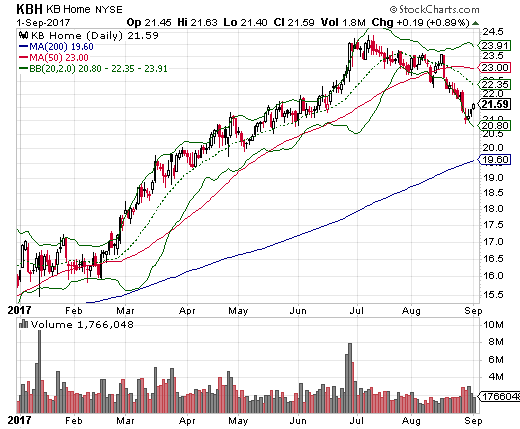
In the last Housing Market Review, I pointed to KBH Home (KBH) as an “imminent lowlight.” Not only did I lose money on the small number of call options I purchased, but KBH itself now looks more bearish than it has looked in a long time. Like ITB and TOL, KBH broke down below its 50DMA in August. Unlike the two, KBH confirmed its 50DMA breakdown as it spent half the month sliding down its lower-Bollinger Band (BB). KBH is still up substantially this year, but looks like it has topped out given the full reversal from its last earnings report in late June. This month’s earnings report will be a key tell; interestingly, recent data show that KBH’s key markets in the West are likely doing quite well.
Source: StockCharts
KB Home is breaking down and looks like it has topped out for the year.
The change in tone in the trading of the stocks of home builders mirrors a slight change in tone in the housing market data. Housing starts increased again and match the resurgence of forward-looking optimism of home builders (as seen in the sentiment indicator in the Housing Market Index). Yet, the recent decline in new home sales threatens a years-long uptrend. Existing home sales have likely confirmed a top for the year even as prices continue climbing robustly and sales are up from a year ago.
New Residential Construction (Housing Starts) – July, 2017
After three months of monthly declines, housing starts finally increased in June. Housing starts declined again for July but the market’s response was very muted this time…and for good reason.
Single-family housing starts for June were revised upward from 849,000 to 860,000. July starts decreased month-over-month by 0.5% to 856,000. This small change did not make a dent with the on-going uptrend. On an annual basis, single-family housing starts increased a healthy 10.9%, similar to last month’s 10.3% year-over-year jump. The first seven months of 2017 have delivered close to and above double-digit percentage gains meaning that the uptrend remains well intact.
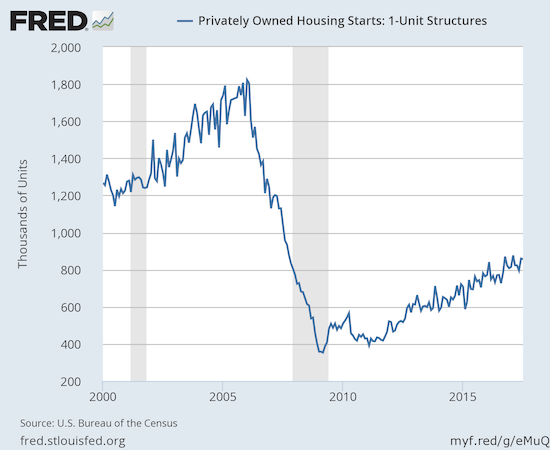
Source: US. Bureau of the Census, Privately Owned Housing Starts: 1-Unit Structures [HOUST1F], retrieved from FRED, Federal Reserve Bank of St. Louis, July 19, 2017.
Single-family housing starts are still printing above 2016 levels.
After three months of wide deviations, the regional changes were more uniform for June and even more so for July. The Northeast, Midwest, South, and West each jumped 13.6%, 16.7%, 8.2%, and 12.9% respectively. The Northeast made a major recovery from June’s year-over-year 19.2% decrease. The West cooled down from a 2-month streak of 22% year-over-year gains.
Existing Home Sales – July, 2017
Again, regular readers should know the routine with the report on existing sales: sales decline because of a shortage of inventory and sales increase in spite of inventory shortages. For July, 2017, sales declined on a monthly basis but still increased on an annual basis.
For January 2017, existing home sales hit levels not seen since February, 2007. For February 2017, existing home sales dropped sharply from the previous month’s post-recession high and served up a reminder of the month-to-month volatility in this series. For March, existing home sales made a sharp rebound and set a new post-recession high (the highest in over 10 years). Sales since have gone up and down like a yo-yo, but July’s decline may have confirmed a top for now as they hit a low for the year. The NAR commentary reflected upon the frustrations of buyers who are paying more for less:


Leave A Comment