
Here is a look at today’s economic data releases. This follows on to yesterday’s big bump in Durable Goods (+4.9% correcting a previous -4.6%).
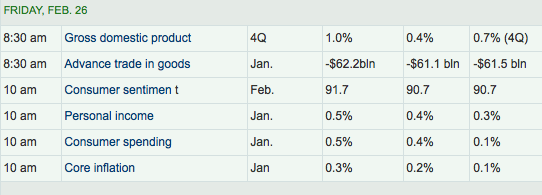
Graphic from MarketWatch
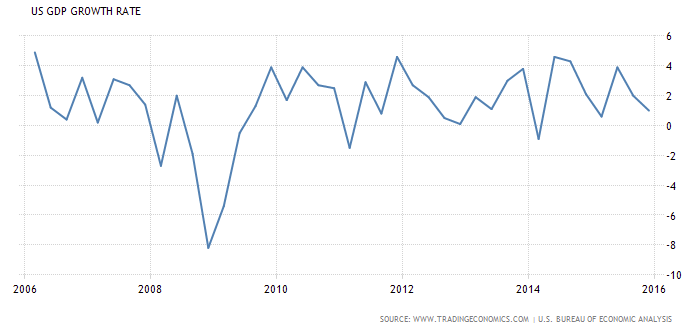
The market is cheering the 1% GDP because after all, it beat the .7% estimate. Okay, fine. Here’s the 10 year GDP growth rate. Inspiring, isn’t it?
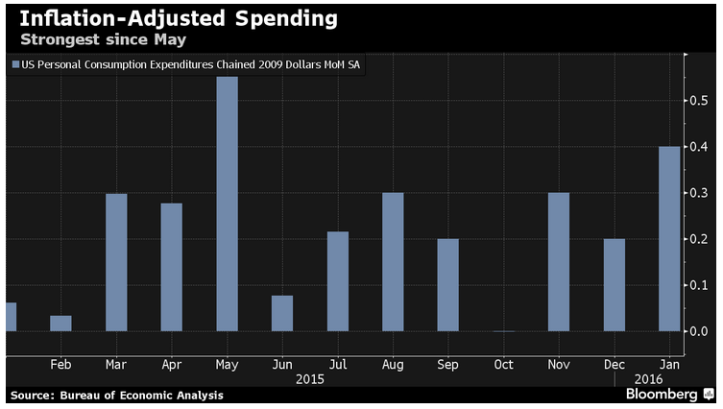
And then we have the plucky consumer, with his rising income (+.3%, +.4%, +.5%…) and declining gas prices, jacking spending in January to the highest inflation adjusted level since May…
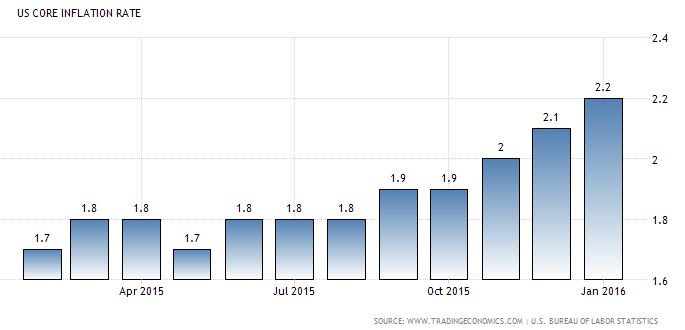
…while ‘core’ inflation rises.
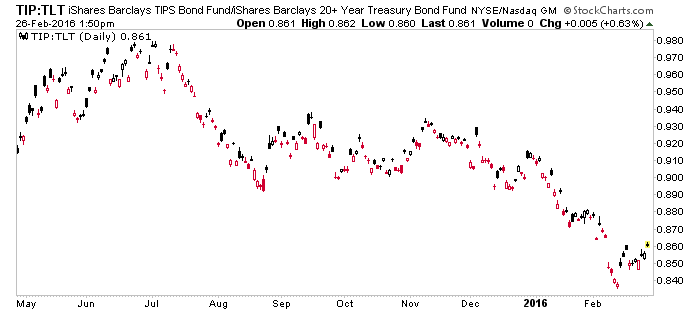
While TIP vs. TLT gets a little bump, but no trend change.
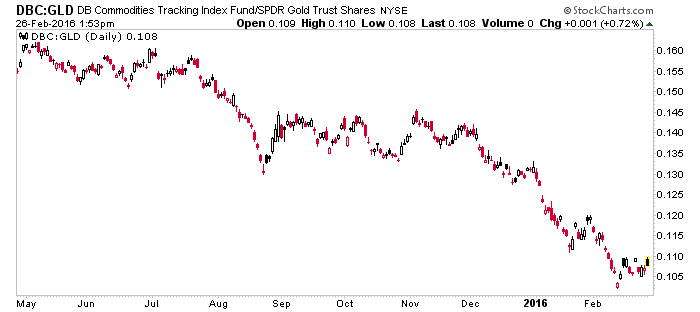
Commodities make only the slightest bump up vs. gold.
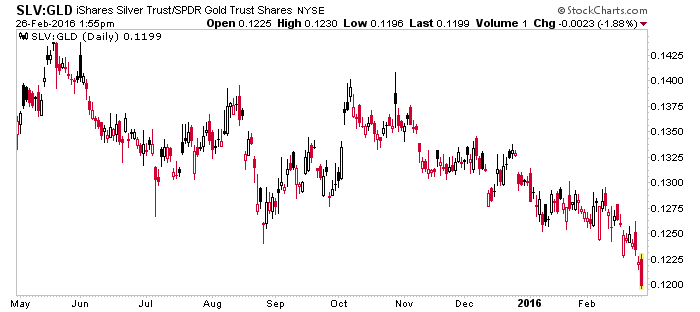
And silver… wait a minute! Silver’s not playing ball.
Silver tends to do things in dramatic fashion, so maybe before an ‘inflation trade’ is signaled, silver will have to get bludgeoned vs. gold and blow off to the downside. Put another way, maybe the Gold-Silver ratio will complete the upside blow off we have expected for years now. The target is after all, the low 80’s up to 90 potentially, if things get really bad. This chart does not include today’s activity. A quick calc. of prices puts the ratio at 83 right now.
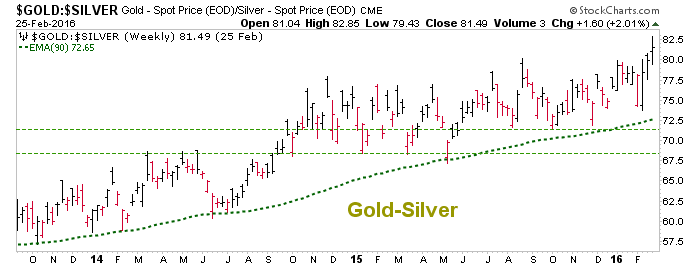
And until this thing stops rising inflation, while in the system, is not going to make too many headlines and the ‘inflation trade’ is going to remain mostly in waiting. If anything, a rising Gold-Silver ratio would continue to stress the financial markets and the economy.


Leave A Comment