
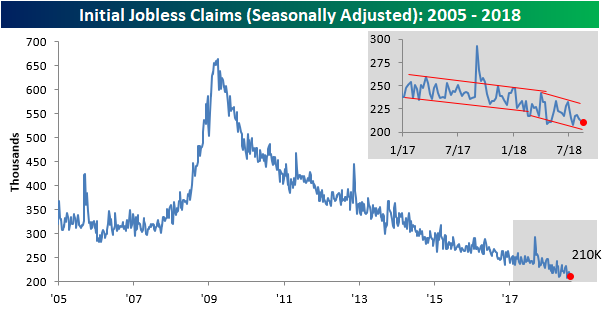
Jobless claims dropped 2K this week, falling from 212K down to 210K, but that was 7K lower than the consensus forecasts from economists. This week’s reading is also within 2K of the multi-decade low of 208K we saw in mid-July.If you look at the inset chart below, it’s almost as though the downtrend in claims is picking up steam! With this week’s reading, claims have been at or below 300K for a record 181 straight weeks, at or below 250K for 46 straight weeks (longest streak since January 1970), and at or below 225K for 7 straight weeks (longest streak since 1969). Those are pretty impressive stats to say the least!
With this week’s drop in claims, we came oh-so-close to a new multi-decade low in the four-week moving average. As shown in the chart below, the four-week moving average dropped to 213.75K. That now puts this indicator within a whisker of its cycle low of 213.5K from May. Also, as long as there are no upward revisions and claims don’t rise by more than 8K next week, we should see this reading drop to a new low!

Finally, on a non-seasonally adjusted basis, jobless claims fell to 172.9K, which was the lowest reading for the current week of the year since 1969. More recently, this week’s print was more than 120K below the average for the current week of the year dating back to 2000.


Leave A Comment