
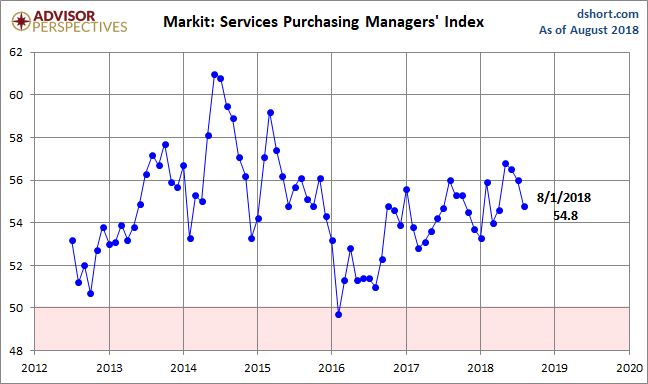
The August US Services Purchasing Managers’ Index conducted by Markit came in at 54.8 percent, down 1.2 from the final July estimate of 56.0. The Investing.com consensus was for 55.2 percent. Markit’s Services PMI is a diffusion index: A reading above 50 indicates expansion in the sector; below 50 indicates contraction.
Here is the opening from the latest press release:
The latest survey data signalled a weaker rise in business activity across the U.S. service sector. Output growth softened to a four-month low and dipped below the long-run series trend. The rate of new business growth softened to an eight-month low, despite remaining strong overall. Subsequently, firms showed evidence of spare capacity with backlogs falling further and employment growth slowing to a seven-month low. Meanwhile, increases in input prices and output charges eased, despite the rate of charge inflation remaining well above the series trend. [Press Release]
Here is a snapshot of the series since mid-2012.
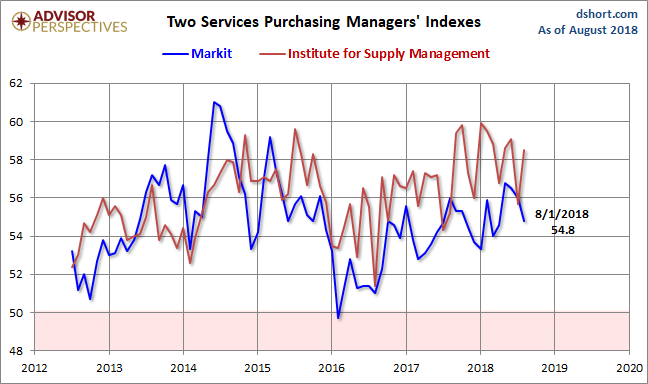
Here is an overlay with the equivalent PMI survey conducted by the Institute for Supply Management, which they refer to as “Non-Manufacturing” (see our full article on this series here). Over the past year, the ISM metric has been significantly the more volatile of the two.
The next chart uses a three-month moving average of the two rather volatile series to facilitate our understanding of the current trend. Since early in 2016, the ISM metric has shown stronger growth than the Markit counterpart.
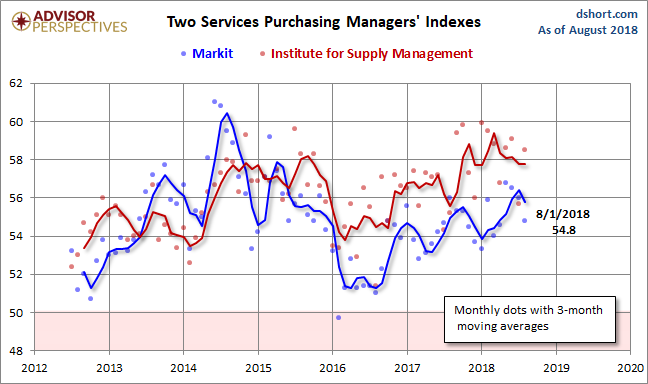
Both series weakened since 2015 and saw an uptick in the latter half of 2016. The interim three-month moving average of the Markit Services index peaked in August of 2014. The ISM index peaked in September of 2015. The two were fairly closely aligned at the beginning of 2016, but they diverged early with the Markit index signaling noticeably weaker growth.


Leave A Comment