
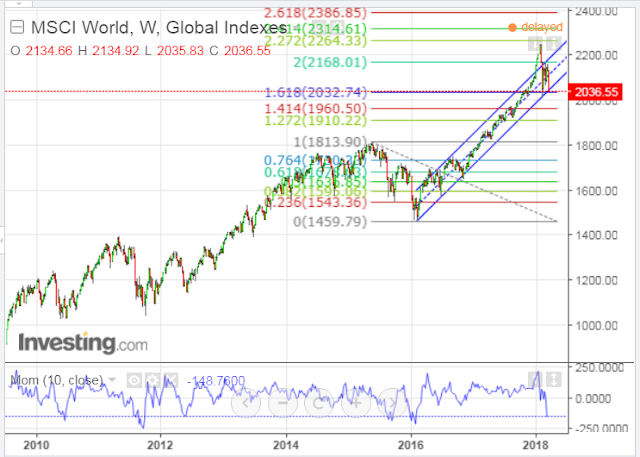
I last wrote about the MSCI World Index in my post of February 10 as one of the volatility gauges to monitor for clues in equity direction. At that time, its price was 2050.90 and I mentioned that 2032.74 was a critical major support level to watch.
Since then, it has dropped further and closed just above that level on Friday, as shown on the following weekly chart.
I’d reiterate that a drop and hold below that level could send all world markets into a tailspin. The dramatic and swift plunge of the momentum indicator (which began in late January) is hinting of further weakness ahead on this timeframe unless we see a swifter and convincing (sustainable) bounce soon. In the meantime, look for wild swings in this index, particularly this coming week, and beyond.
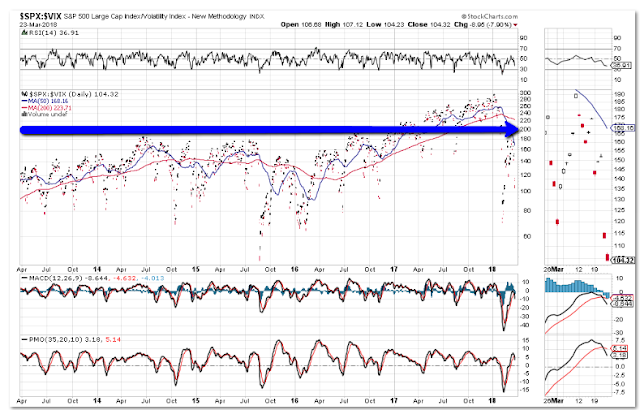
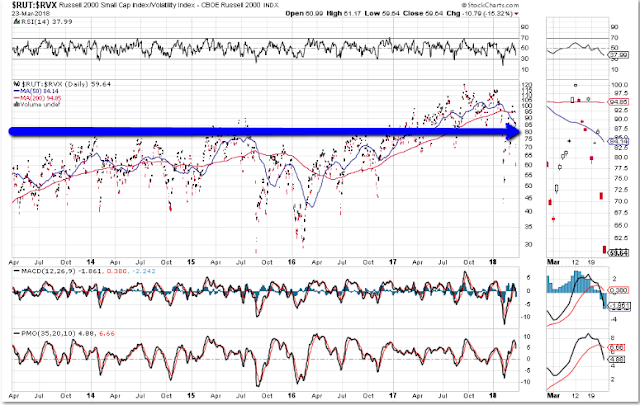
Also, as a follow-up to my post of March 10, I’d just include an update on the following three equity volatility daily ratio charts (SPX:VIX, NDX:VXN, and RUT/RVX).
Once again, all three ratios have fallen below their critical support levels of 200, 350, and 80, respectively, are back below both their 50 and 200-day moving averages and are still trading under the bearish influence of a moving average Death Cross formation. Furthermore, a new “SELL” signal has formed on the RSI, MACD, and PMO indicators…hinting of further weakness ahead.
As is the case of the MSCI World Index, no doubt, we’ll also see some wild swings made this coming week and beyond on these ratios. Volatility will remain elevated until:

Finally, most of the Major U.S. Indices and Major Sectors are under water in terms of their losses made, year-to-date, as shown on the following graphs.


Leave A Comment