The U.S. Census Bureau and the Department of Housing and Urban Development have now published their findings for September new residential housing starts. The latest reading of 1.127M was well below the Investing.com forecast of 1.180M and a decrease from the previous month’s upwardly revised 1.183M.
Here is the opening of this morning’s monthly report:
Building Permits
Privately-owned housing units authorized by building permits in September were at a seasonally adjusted annual rate of 1,215,000. This is 4.5 percent (±1.6 percent) below the revised August rate of 1,272,000 and is 4.3 percent (±1.7 percent) below the September 2016 rate of 1,270,000. Single-family authorizations in September were at a rate of 819,000; this is 2.4 percent (±1.7 percent) above the revised August figure of 800,000. Authorizations of units in buildings with five units or more were at a rate of 360,000 in September.
Housing Starts
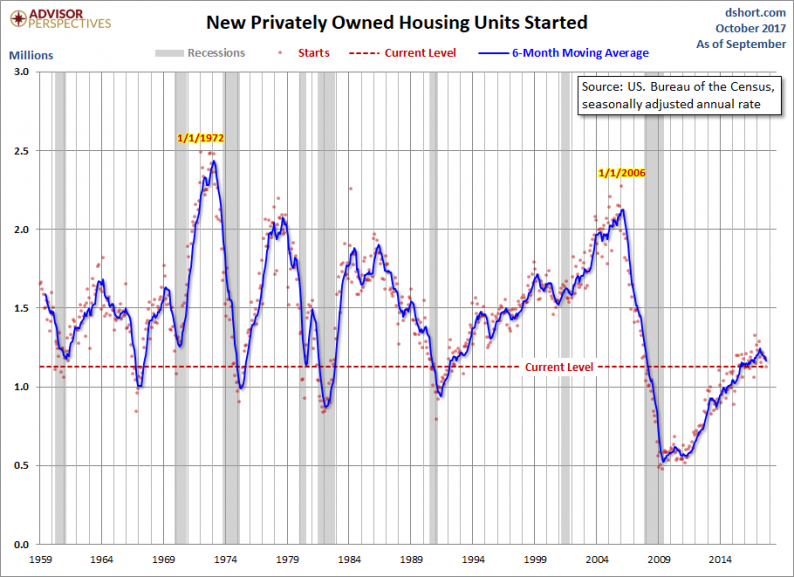
Privately-owned housing starts in September were at a seasonally adjusted annual rate of 1,127,000. This is 4.7 percent (±8.1 percent)* below the revised August estimate of 1,183,000, but is 6.1 percent (±8.8 percent)* above the September 2016 rate of 1,062,000. Single-family housing starts in September were at a rate of 829,000; this is 4.6 percent (±8.5 percent)* below the revised August figure of 869,000. The September rate for units in buildings with five units or more was 286,000. [link to report]
Here is the historical series for total privately-owned housing starts, which dates from 1959. Because of the extreme volatility of the monthly data points, a 6-month moving average has been included.

The Population-Adjusted Reality
Here is the data with a simple population adjustment. The Census Bureau’s mid-month population estimates show substantial growth in the US population since 1959. Here is a chart of housing starts as a percent of the population. We’ve added a linear regression through the monthly data to highlight the trend.


Leave A Comment