
Thanks to yesterday’s session crude oil lost 3% and approached the previously-broken barrier of $70. In this area, oil bears met several other short-term supports, but are they stable enough to stop the sellers in the coming days?
Let’s take a look at the charts below (charts courtesy of http://stockcharts.com).
Long-term Perspective – Invalidations!

In our last Oil Trading Alert, we wrote that (…) the commodity approached the upper border of the red zone, which suggests that we can see an invalidation of the earlier breakout above it in the coming days (…).
As you see on the monthly chart the situation developed in tune with our assumptions and crude oil closed yesterday’s session not only below the upper line of the above-mentioned zone but also under the previously broken 38.2% Fibonacci retracement based on the entire 2008-2016 downward move.
In this way, the commodity invalidated the earlier breakouts, which doesn’t bode well for oil bulls – especially when we factor in the current position of the long-term indicators (the Stochastic Oscillator generated the sell signal after several months of bearish divergences and the CCI is very close to doing the same – in this case we could also observe a deepening bearish divergence).
Medium-term Chart and the Pattern
Are there any other negative technical developments? Let’s zoom in a bit our picture and examine the weekly chart. What can we infer from it?
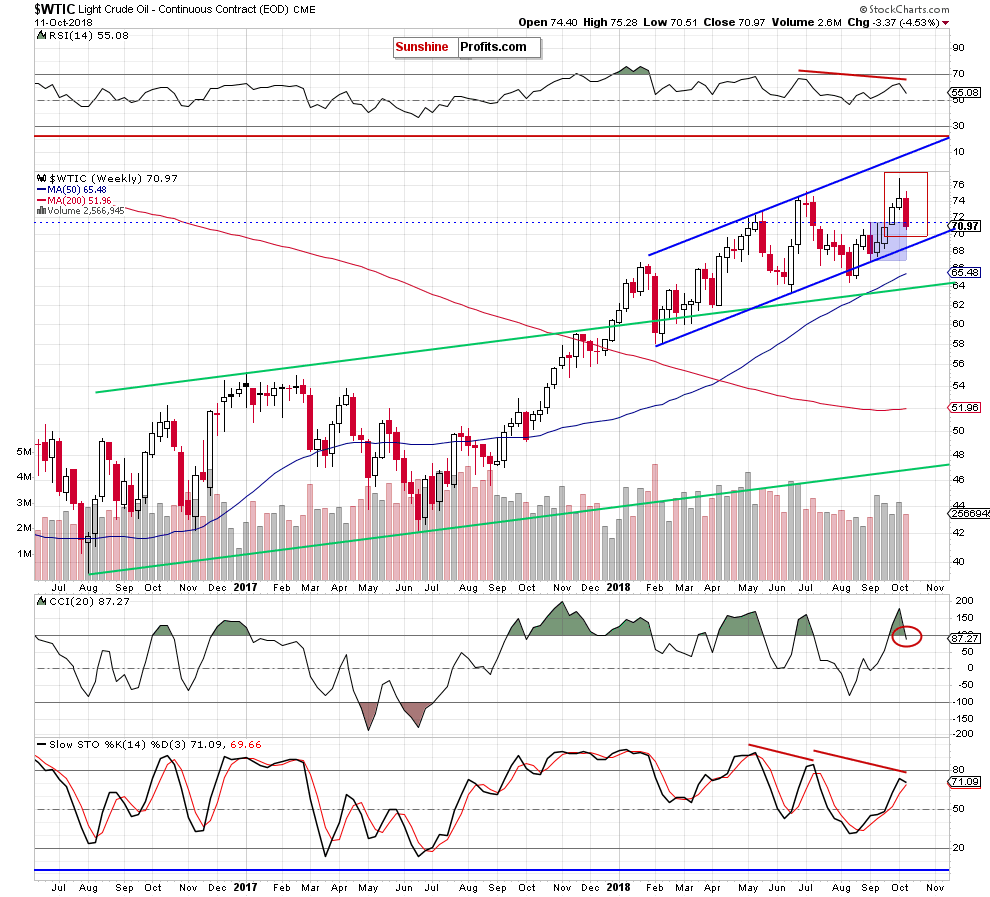
The first thing that caught our eyes on the medium-term chart was an invalidation of the earlier breakout above the upper line of the blue consolidation. Thanks to yesterday’s decline (which made our short positions even more profitable) the bears’ chances for creating a pro-decline candlestick formation (the evening star) significantly increased.
What exactly does the formation look like and what does it mean?


Leave A Comment