
Three times.
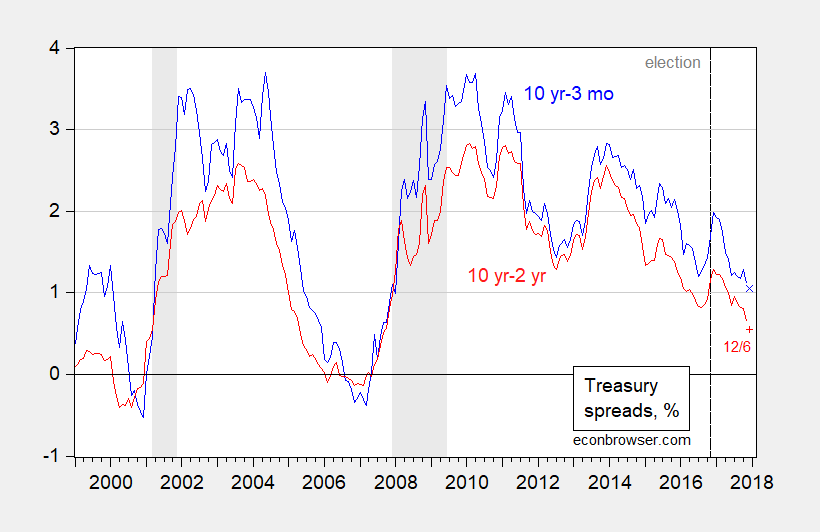
Figure 1: Ten year minus three month Treasury spread (blue), and ten year minus three month Treasury spread (blue). December observations pertain to 12/6 daily observation. NBER defined recession dates shaded gray. Source: Federal Reserve via FRED, NBER and author’s calculations.
In general, once the yield spread is shrinking, it continues to shrink (so the question posed pertains to observations of the 1% threshold being breached as the spread goes down). You can see these instances where the yield curve breaches 1% from the topside in the following graph (red arrows).
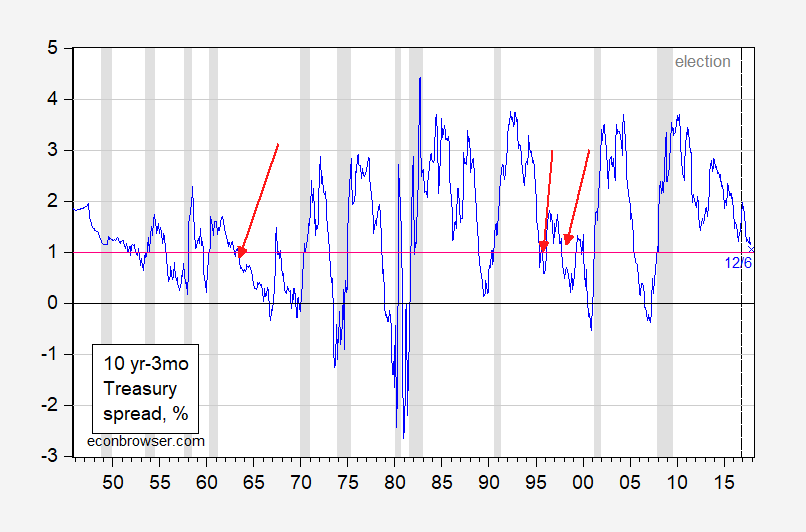
Figure 2: Ten year minus three month Treasury spread (blue); December observation (blue x) pertains to 12/6 daily observation. NBER defined recession dates shaded gray. Red arrow denotes observation where spread cuts 1% threshold from above and then rises again and/or no recession follows. Source: Federal Reserve via FRED, NBER and author’s calculations.
So…inversion (which is increasingly considered plausible) is not necessary to say a recession is likely impending.
This is a informal approach; a formal, statistical approach involves running a probit regression 1967M01-2017M11:
recessiont+6 = -0.332 -0.575×(GS10-TB3MS)t + ut
Both coefficients are statistically significant (the McFadden R2 = 0.22); the implied probability of recession is 16% for May 2018.
This is slightly higher than the estimates I obtained using this specification back in September. Of course, this formal forecast assumes that the behavior of the term premium is unchanged over time, a presumption that is questionable.
For more formal, cross-country, analyses, see Chinn and Kucko (2015).


Leave A Comment