
We have some good news and some bad news for both: precious metals bulls and bears. Based on new developments it’s even more likely that we are just before the huge price decline in gold, silver, and mining stocks, but at the same time, it also appears likely that the final bottom will take place later than we had expected, based on the previously available information.
Let’s start with additional bearish confirmations (charts courtesy of StockCharts). In our Monday’s analysis, we compared the price performance of gold that we saw in the recent months to what happened in 2013, right before the big $200+ plunge that took place in only 2 trading days. In today’s analysis, we will extend this analogy also to other markets. But first, let’s recall the Monday’s analysis.
Gold: 2013 vs. 2018
On Monday, we featured the following two charts: one from 2013 and one from this year and we managed to describe them using exactly the same words:
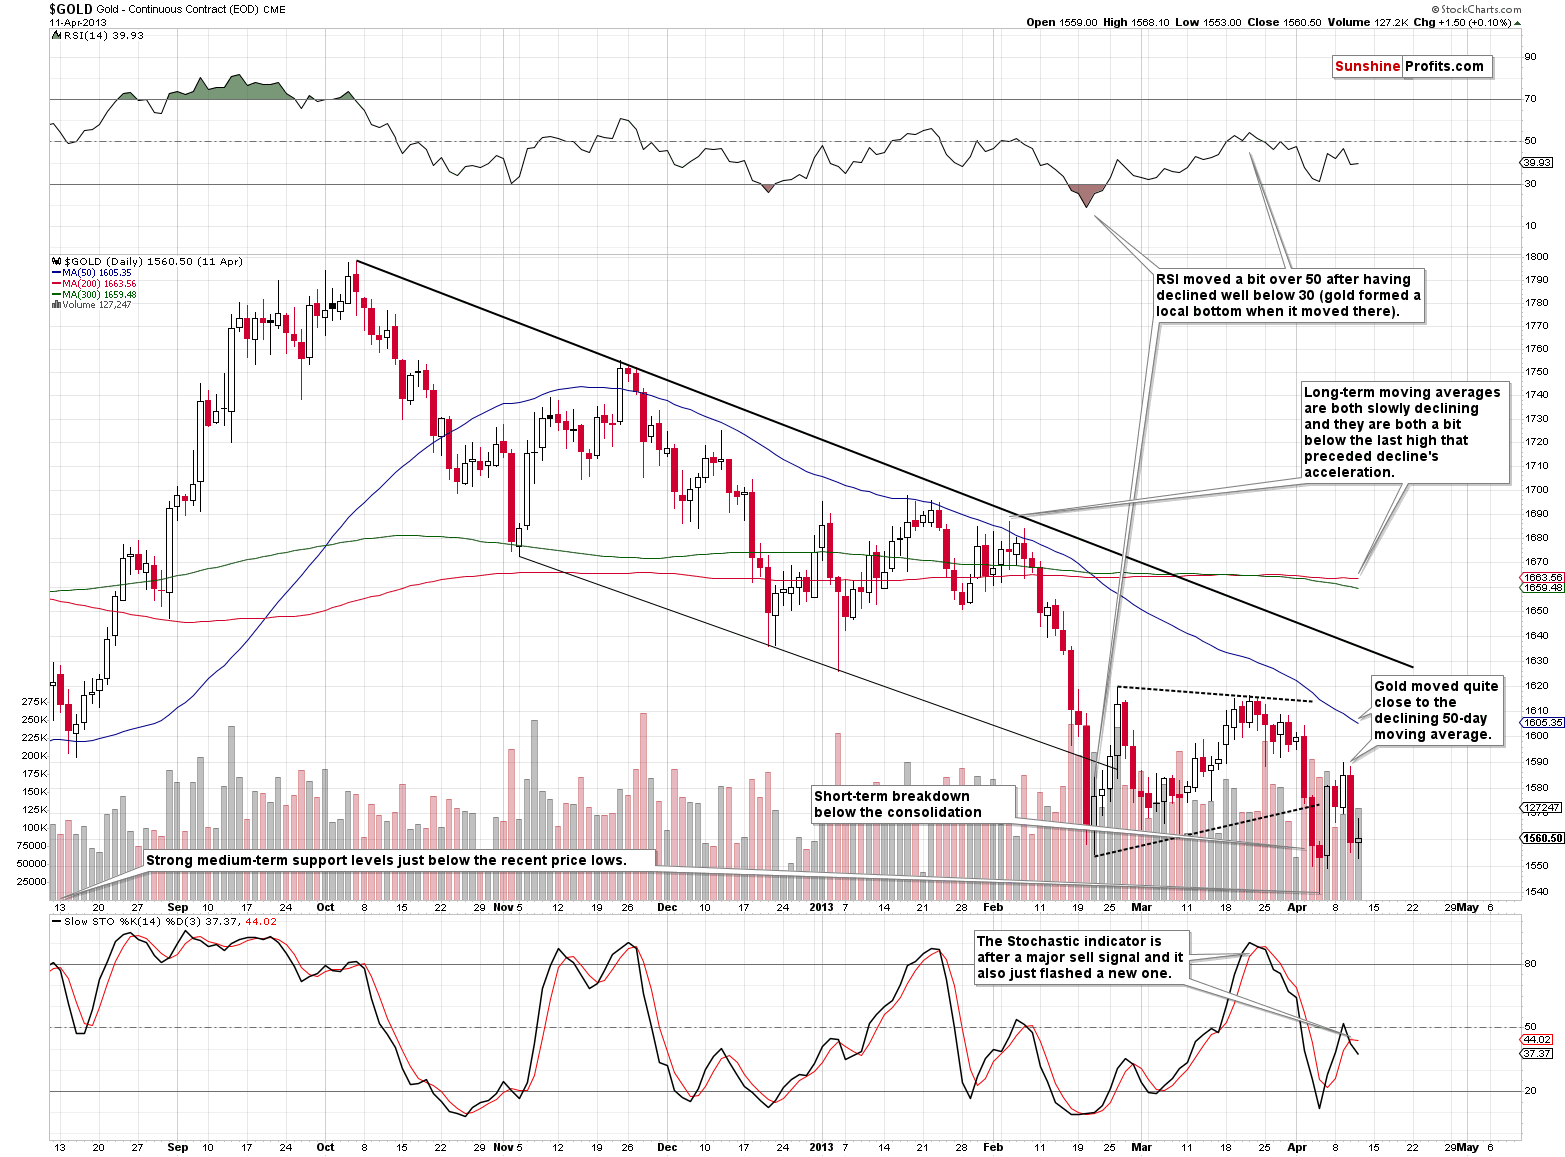

Gold moved back and forth lately as it’s been consolidating after the recent sharp decline that took gold to the medium-term support levels (even a bit below some of them) and the declining thin black support line (based on the previous lows).
The yellow metal moved close to its 50-day moving average (staying below it) and it’s still far from the declining black resistance line, which suggests that the trend remains down and that everything that we saw recently is just a pause within a bigger decline.
The RSI indicator was very oversold on a short-term basis during the recent volatile bottoming pattern, but it recovered since that time, and it recently even moved above 50, thus indicating that the situation is far from being very oversold on a short-term basis.
The Stochastic indicator already confirmed that the major short-term top is already in and we just saw another move lower in it, after it moved above the middle of its trading range.
Moreover, gold already broke below the consolidation pattern marked with dashed lines and even though it moved very briefly back into the pattern, it closed the last two sessions visibly below it.
Some will say that what we’re seeing is just a prolonged bottoming pattern and what we have now is the first post-bottom pause. But we disagree. Based on multiple other factors, including severe underperformance of gold stocks, the outlook remains strongly bearish and gold price appears ready to decline once again.
We emphasized that the shocking similarity can be seen not just in the position of indicators, proximity to the support and resistance lines, situation regarding the consolidation pattern, and the 50- a day moving average. Even the 200-, and 300- a day moving averages (marked with red and green) are slowly declining and are just below the local top after which the decline accelerated.


Leave A Comment