
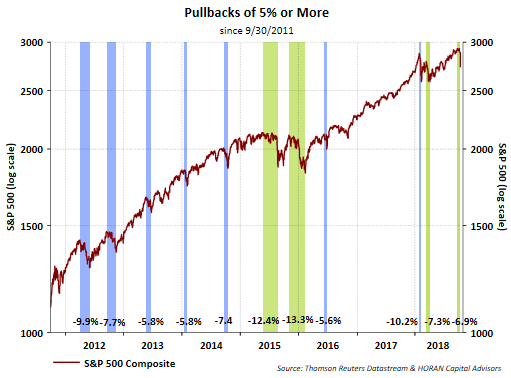
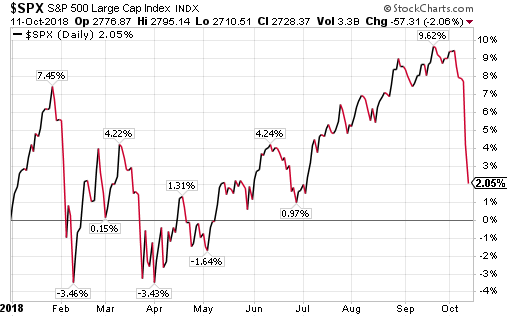
From early 2016 to early 2018 the S&P 500 Index moved higher with very little downside volatility. As the below chart shows, that stretch of time was an abnormally long one in terms very little downside market move. One consequence of this low volatility period is many investors’ began to believe the equity market does not go down. In reality, a low volatility market is not normal though. Having the market pullback between 5-10% once or twice a year should be expected by equity investors. The current decline from peak to current level is only 6.9%.
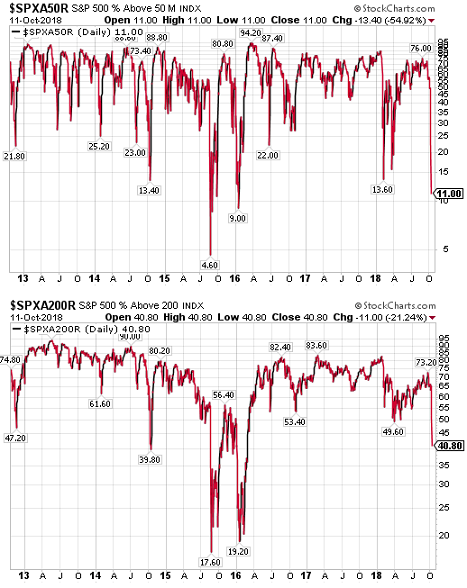
Some might say the decline has caused damage to the market, but a better phrase might be created opportunity. As the below chart shows only 11% of S&P 500 stocks are trading above their 50-day moving average. The last time this occurred was in February earlier this year. That turns out to be a low point in the market so far in 2018. In regards to the 200-day moving average, 41% of stocks are trading above that level, again similar to the early 2018 market low.
And finally, over the course of the last several days, I have published posts on sentiment that is becoming increasingly bearish, here and here. These sentiment measures are contrarian ones and are most actionable at extremes. Maybe the bearishness level is indicating a market that is near a turning point, one that wants to turn higher. And just for good measure, below is CNN Business’ Fear and Greed Index. This index can not go much lower or get anymore fearful.
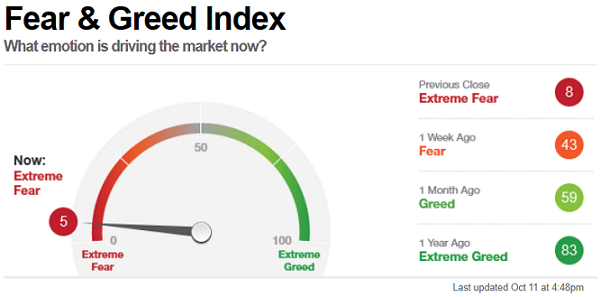
As Warren Buffett has been noted as saying, “Be Fearful when others are greedy and greedy when others are fearful.” Could this be the time for investors to be just a little more greedy?


Leave A Comment