
Closing out the 1st week of earnings season found the major averages higher last week. In the wake of earnings results from Citigroup, Wells Fargo, Blackrock and JP Morgan Chase, however, investors found the earnings reports to be a sell the news type of event. The banks and financial institutions managed to beat results handily, but found their share prices under pressure shortly thereafter. While the bulk of this week’s reports are dominated by the Finance sector, other sectors will be dripping earnings reports throughout the week.
As it pertains to the financial sector’s earnings, they were only up +1.2% in FY17 and in the low single digits in the 3 years prior to that. Expectations have much improved for 2018 though and on the heels of an improving economy with benefits from tax reform and higher interest rates. Financial sector earnings are expected to be up some 25% in 2018 according to Zach’s Research.
So why did the likes of Citigroup, Wells Fargo and JP Morgan Chase sell-off after the release of their respective Q1 2018 results? One basic and understandable reason could be the simplicity of a “sell the news” event. There is also likely a comparability ground for the market’s lack of appreciation for the results, as 2 new accounting rules took effect this quarter. This week we’ll have a great more data and earnings reports from the financial sector. The sector’s earnings growth momentum is expected to continue in the coming quarters.
suggest that individual bank stocks may see some lift throughout the quarter, but only if the broader market finds investor appreciation. We believe it more optimal to participate with the Financial Sector Spiders (XLF) instead of trying to pinpoint which bank stock will appreciate with greater probability.
As it pertains to bank earnings, credit spreads continue to weigh on investor sentiment as a whole for the sector, although that factor is greatly improved when compared to early February as spreads hit their highs. The 10-year/2-year U.S. Treasury spread has been narrowing since the market sell-off in equities at the beginning of February. The spread hit a year-to-date high of 78 basis points on Feb. 9 but has since narrowed to 48 basis points.
With the financial sector in focus this coming week, we now take a look at the market as a whole under the context of valuation. According to data from FTSE Russell and Thomson Reuters, the U.S. stock market was recently trading at its most expensive levels since the dot-com era. This is not an “ah ha” moment as most investors understand the market’s historic valuation and readily justify it based on corporate earnings growth expectations for 2018.
The historic median S&P 500 PE ratio is about 15. The present PE ratio on the S&P 500 stands around 17 as depicted in the chart below.
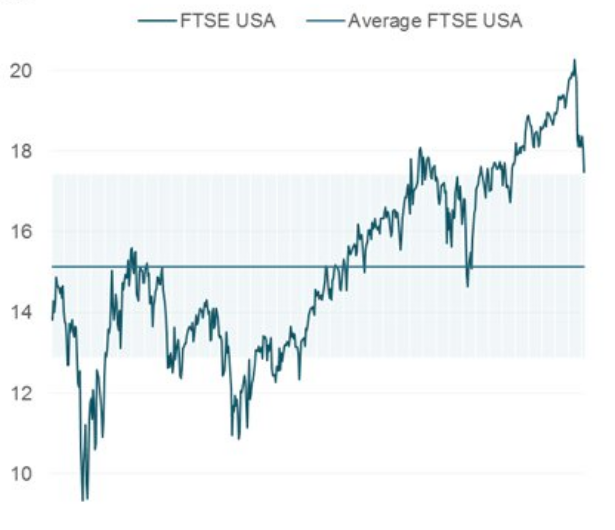
Again, while valuation seems stretched and at levels not seen since the dot.com era some 20 years ago, it comes due in part to strong corporate earnings growth expectations. When we take into account that earnings are expected to grow between 16.5% and 18% for 2018, depending on the data tracking firm, one might draw the conclusion that the S&P 500 is somewhat undervalued. If we look at valuations using PEG ratio, based on this metric, stocks have a PEG of 1.2.


Leave A Comment