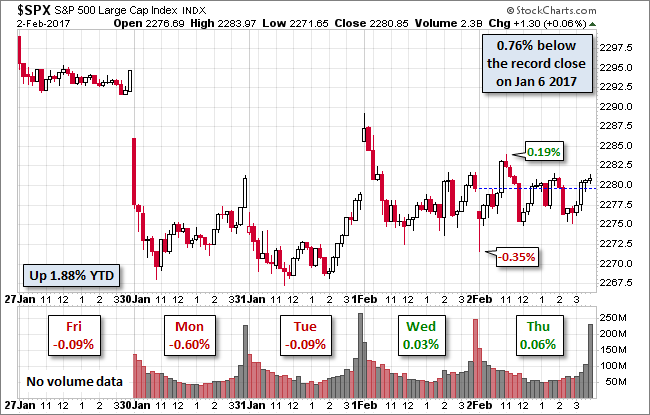
The S&P 500 has essentially gone nowhere for the past three sessions, logging three fractional moves. The index spent the day zig-zagging around yesterday’s closing price, ending the session with a 0.06% closing gain. Today’s close at 2,280.85 is a whisker below the Monday close at 2,280.90.

The U.S. Treasury puts the closing yield on the 10-year note at 2.48%, unchanged from the previous close.
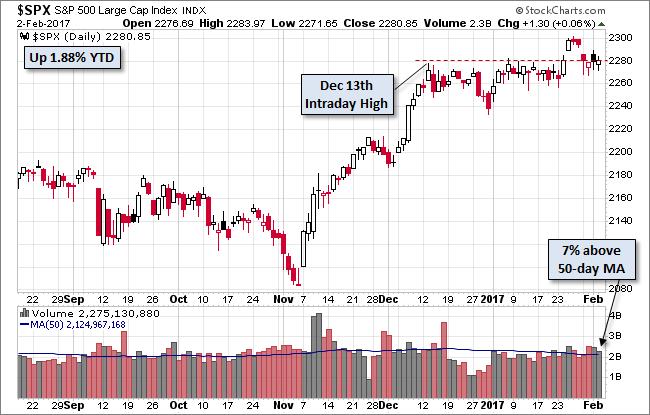
Here is a daily chart of the S&P 500. We can see that today’s close is just a tad above the intraday high back in mid-December.
A Perspective on Drawdowns
Here’s a snapshot of record highs and selloffs since the 2009 trough.
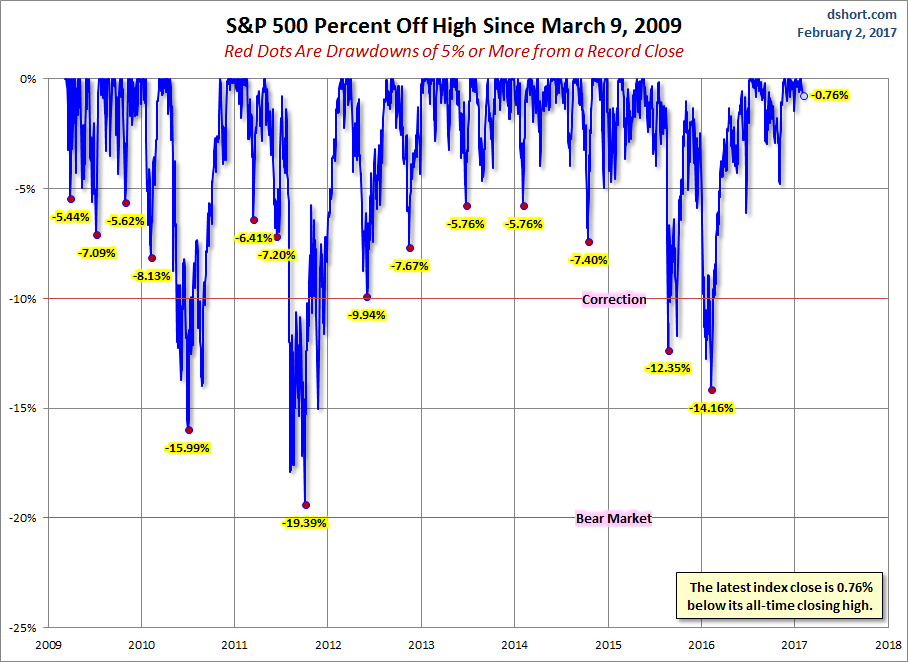
Here is a more conventional log-scale chart with drawdowns highlighted.

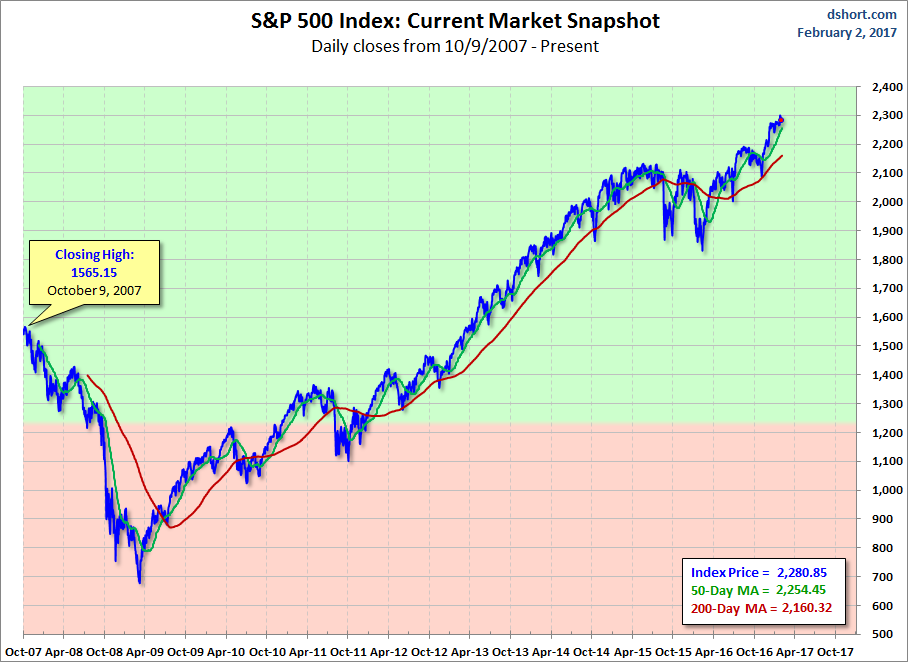
Here is a linear scale version of the same chart with the 50- and 200-day moving averages.
A Perspective on Volatility
For a sense of the correlation between the closing price and intraday volatility, the chart below overlays the S&P 500 since 2007 with the intraday price range. We’ve also included a 20-day moving average to help identify trends in volatility.


Leave A Comment