Even with all the rotation we have seen in equity prices over the last couple of weeks, the S&P 500 still managed to close at an all-time high on Friday and is just half of a percent below its intraday record high.
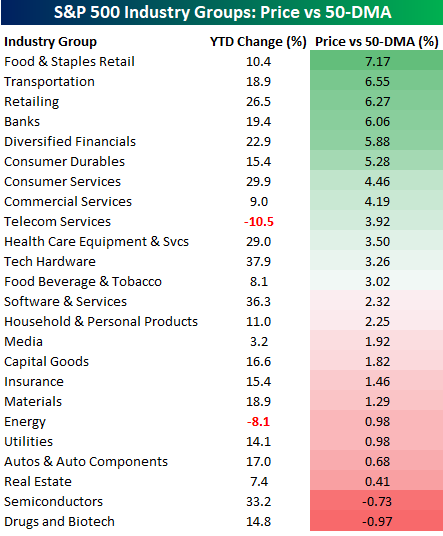
Following all the relatively big swings (up and down) in various groups, there’s been a lot of movement in where the S&P 500’s industry groups stand relative to their 50-DMA. As shown in the table below, practically every industry group closed last week above its 50-DMA. Leading the way higher, Food & Staples Retail, Transportation, Retailing, and Banks are all at least 6% above their 50-DMA, while the only two groups below their 50-DMA are Drugs and Biotech and Semis.
These two groups are also less than a 1% below their 50-DMAs, so all in all breadth is really strong. YTD market performance has also been strong this year, as the only two industry groups in the red YTD are Telecom Services (-10.5%), which is just three stocks and Energy (-8.1%).

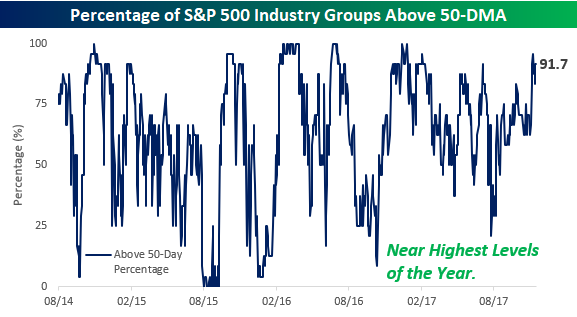
The chart below shows the daily reading of the percentage of S&P 500 industry groups trading above their 50-DMA. At the current level of 91.7%, the percentage is currently not only right near its highs for the year, but also near its highs of the bull market. While there have been times when this percentage was higher, anytime you are in the 90s in terms of percentages, there’s only so much higher you can go.


Leave A Comment