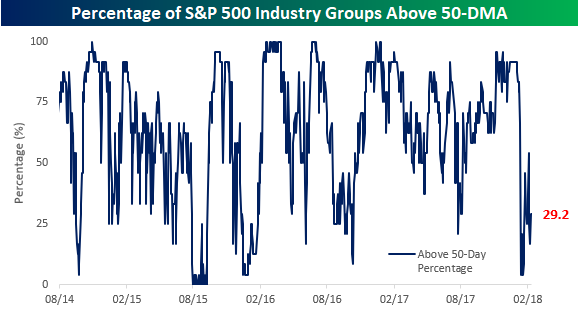
As the S&P 500 continues to churn around below its all-time highs from January, we are beginning to see short-term breadth readings start to weaken. While strong breadth is always preferable to weak breadth, given the declines we have seen in price, it should come as no surprise that the number of industry groups with rising 50-day moving averages (DMA) and the number trading above their 50-DMAs has also declined.
Starting with the percentage of industry groups above their 50-DMA, after falling down close to zero in early February, it has rebounded some but still remains below a third at 29.4%. You may recall that prior to Monday’s rally, this reading was considerably lower at just 16.7%.

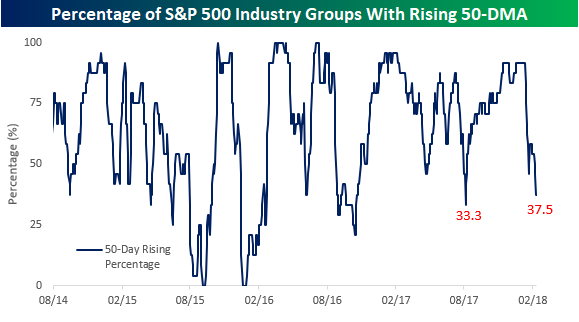
The longer industry groups trade below their 50-DMA, the more likely it is also that the direction of their 50-DMAs starts to turn lower as well. As shown in the chart below, just 37.5% of S&P 500 industry groups have rising 50-DMAs.The last time the reading was this low was late last summer, and before that, you would need to go back to right before the 2016 election. Investors have certainly become a bit antsier over the last few weeks, and given that it has been pretty uncommon over the last two years to see so many industry groups with falling 50-DMAs over the last two years, that sense of unease is understandable.
The table below lists the YTD performance of all 24 S&P 500 industry groups along with where they are trading relative to their 50-DMA.Given the year is still young, the fact that the best performers YTD are the furthest above their 50-DMA (and vice versa) shouldn’t come as much of a surprise.Leading the way higher this year, the Retailing Industry Group has been the best performer with a YTD gain of over 15%!The performance of this group, however, is completely misleading.While a number of traditional brick and mortar retailers are up on the year, the bulk of the group’s gains have come from Amazon (AMZN), Netflix (NFLX), and Booking (formerly Priceline), which are up 32%, 67%, and 20% YTD, respectively.The average return of the traditional brick and mortar retailers in the groups is actually a decline of 0.4% YTD.


Leave A Comment