Silver miners have confused bulls and bears in 2017, including us. This is what we wrote throughout the year:
Silver miners trading sideways not bullish nor bearish – August 2017
Silver miners break down – look bearish in 2017 – July 2017
Silver miners are confusing both bulls and bears – June 2017
Silver miners have another awesome chart setup – May 2017
How much worse can it be? The picture in silver miners changed every month. We concluded in August that the situation was neutral, because, according to the chart, a sideways pattern started.
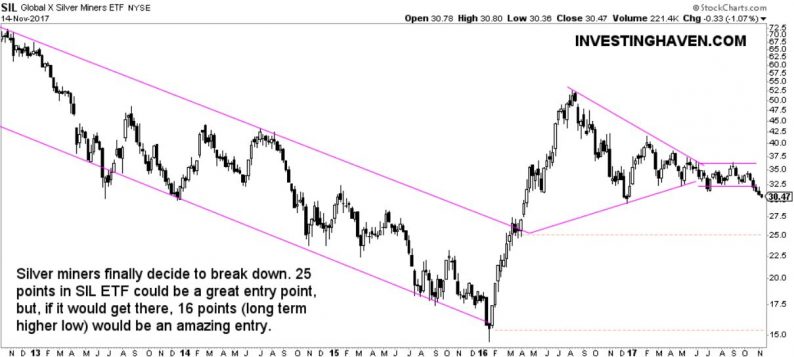
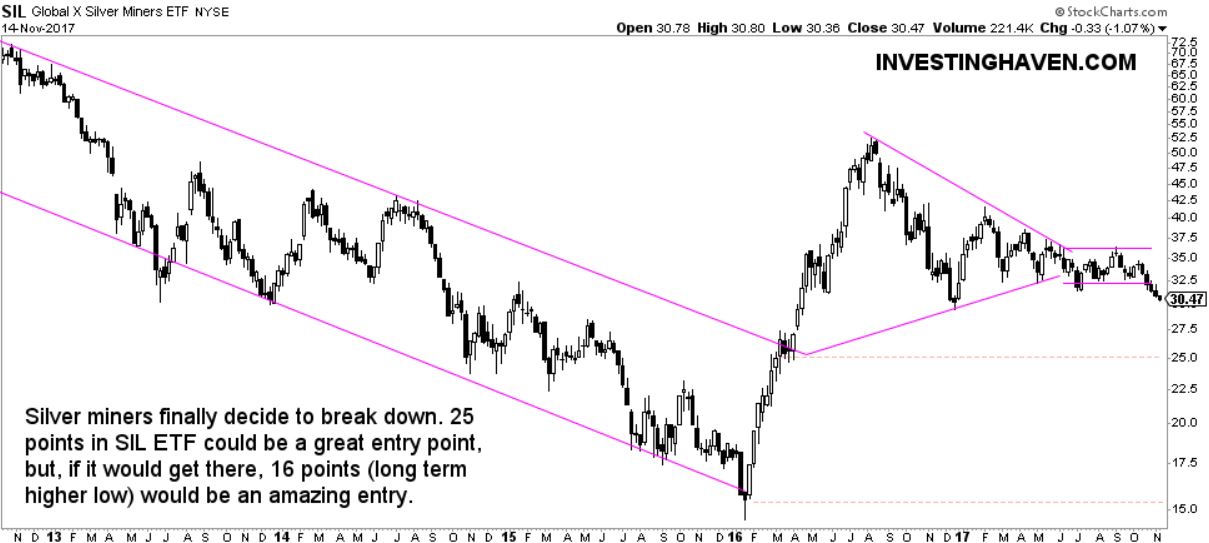
As of this week the sideways pattern got broken.
Given how ‘capricious’ this market has been in the last 12 months we prefer to be cautious now. That is why the title of this article suggests that silver miners are breaking down, as opposed to “they official broke down”.
We will need to give silver miners a bit more time to get a confirmation.
How low can silver miners fall?
The SIL ET shows that there are two points to which they are gravitating. The first point seems a likely target: 25 points. However, if this becomes a sharp correction, we could see a fall to 16 points. If that were to take place it would offer an amazing entry point as it would mark a higher low (potentially) against December 2015 in which case it could be the ultimate retest of the lows before silver miners take off into a new bull market.


Leave A Comment