
Stock futures projected another big down day today for stocks, as if losing 1,150 yesterday on the Dow wasn’t enough.
This will put us at “a line in the sand” that will show whether this is just a sharp 10% correction or the first wave down of the next major bubble burst, which could see us lose another 40%-plus in the first 2.5 to 3 months – that means by late April!
That makes this an especially important point for protecting your wealth.
Stocks accelerate upward in a narrowing trend with less and less volatility, and then crash when they break through the bottom trendline.
Right now, we’re testing that bottom trend line.
Talking with my friend, Andrew Pancholi, at markettimingreport.com, he had two key turning points for this accelerating pattern to top.
The first was mid-October, which turned out to be an acceleration instead, something that happens about 10% of the time.
His next target was January 18-19 and the 25th. It looks to me like January 26 was “the top.”
Let’s look at the broader S&P 500. It looks the closest to breaking down from this pattern.
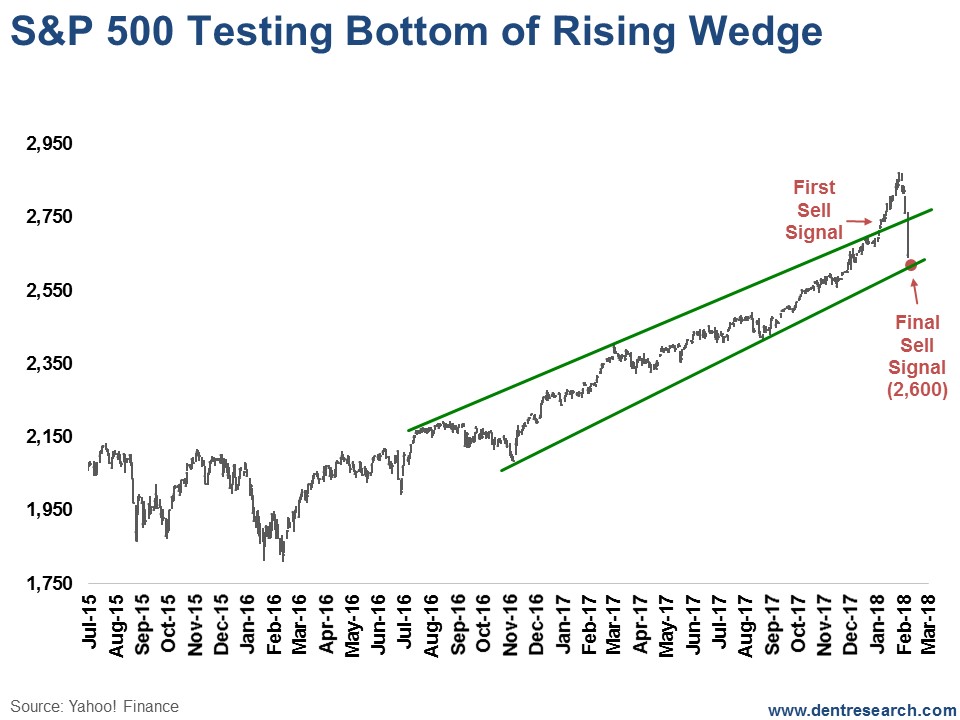
Futures were very volatile last night and this morning, with the S&P projected to open down anywhere between 39 and 72 points. It’s like a chicken running around with its head cut off.
This chart is as of yesterday’s close. Such an opening will put it right smack on the bottom trend line at 2,600 – down 49 points from yesterday – possibly just below it.
So, this is the do or die point!
For the Dow, that bottom trend line – the breaking point – is 23,600.
For the Nasdaq, it’s 6,850.
Note that all of these charts have had a classic throw-over the top, which is the most aggressive sell signal. The highest probability sell signal comes when it conclusively breaks through the bottom.
All of that said, the odds are the markets will bounce off this support point. If they do, the next question is: will they bounce strongly and potentially go back up to as high as the top trendline, which would be around 2,720 on the S&P 500?


Leave A Comment