
The U.S. stock market indexes gained between 0.2% and 1.0% on Wednesday, as investors reacted to better-than-expected economic data releases. The S&P 500 index has reached yet another new record high at the level of 2,916.50. The Dow Jones Industrial Average gained just 0.2% and the technology Nasdaq Composite gained 1.0% yesterday.
The nearest important level of support of the S&P 500 index is now at around 2,900, marked by the previous short-term resistance level. The next support level is at 2,875-2,885, marked by Monday’s daily gap up of 2,876.16-2,884.69. The support level is also at 2,860-2,865., On the other hand, potential resistance level is at 2,950-3,000.
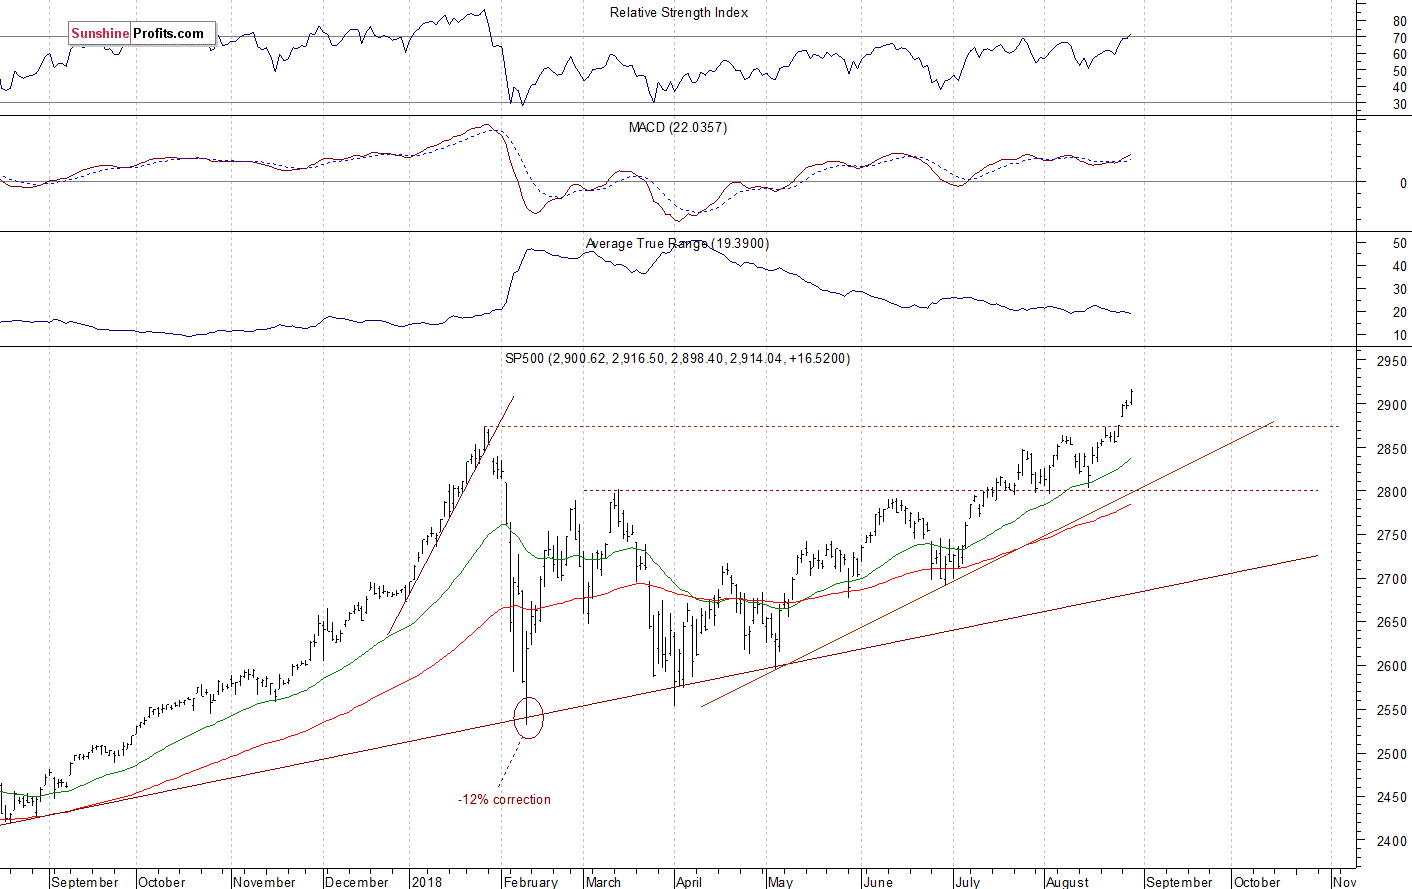
The broad stock market reached another new record high yesterday, as it extended its short-term uptrend above the level of 2,900. We may see more upward price action in the near term, but some downward correction may be coming. The market has retraced its late January – early February downward correction recently. So will it continue towards 3,000 mark? The index trades above its medium-term upward trend line, as we can see on the daily chart:
Downward Correction?
Expectations before the opening of today’s trading session are slightly negative, because the index futures trade 0.2% below their Wednesday’s closing prices. The European stock market indexes have lost 0.2-0.6% so far. Investors will wait for some economic data announcements today: Personal Spending, Personal Income, Initial Claims at 8:30 a.m. The broad stock market will probably open slightly lower today. We may see some short-term downward correction following the recent rally. There have been no confirmed negative signals so far. However, we can see technical overbought conditions.
The S&P 500 futures contract trades within an intraday downtrend, as it retraces some of its yesterday’s rally. The nearest important level of resistance is at around 2,910-2,915, marked by the new record high. On the other hand, support level is at 2,895-2,900, among others. The futures contract trades above its few-day-long upward trend line, as we can see on the 15-minute chart:


Leave A Comment