
Stocks are selling off, but major indices are at/near crucial support, testing the will of the bulls.
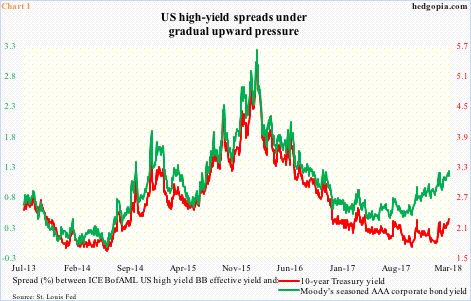
High-yield spreads are tightening. In Chart 1, the ICE BofAML US high yield BB effective yield is pitted against Moody’s seasoned AAA corporate bond yield and the 10-year Treasury rate.
Spreads over both corporate investment-grade and 10-year Treasurys have been gradually inching higher in a sawtooth pattern for a while now. The former in particular has been in a sharper uptrend. As of last Thursday, the yield difference between investment-grade and high-yield was 1.18 percent, up from .37 percent last May. Investors are beginning to seek protection in more reliable companies.
Be that as it may, the green line – as well as the red line – is nowhere near the highs of February 2016. There was a mini panic back then, which was also when US stocks reached a major bottom.
Fast forward to now, stocks once again are selling off. January was very strong, but this has been followed by weakness in February and March-to-date.
It is too soon to say if stocks are pricing in a scenario in which the current trajectory in Chart 1 continues. But cracks are beginning to show in technicals.
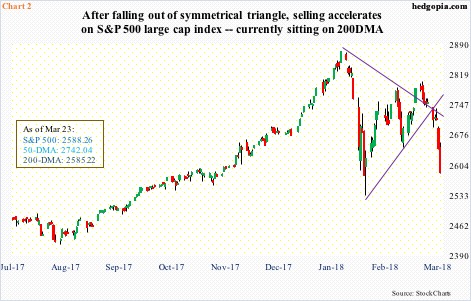
After peaking on January 26 at 2872.87 followed by a reversal low of 2532.69 on February 9, the S&P 500 large-cap index pretty much traded within a symmetrical triangle (Chart 1). Monday last week, it fell out of it. This was followed by rejection post-FOMC decision Wednesday at a confluence of moving averages, including the 50-day. Friday, the index essentially closed on the 200-day. On February 9, this average was tested successfully.
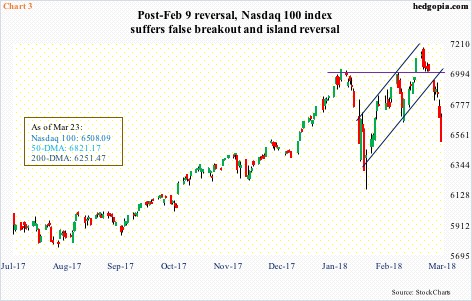
On the Nasdaq 100, no sooner did a breakout occur 11 sessions ago than it was lost (Chart 3). Following that breakout, the index did rise to a new intraday high of 7186.09 on March 13, but it came in a bearish engulfing session. Last week, it fell out of a seven-week rising channel.


Leave A Comment