The stock market’s volatility is very high right now. And by “volatility”, we’re not referring to VIX. We’re referring to the S&P 500’s daily % movements.
The stock market’s high volatility right now is not rare. There were a lot of historical periods with high volatility. What’s rare is that the stock market’s high volatility right now was preceded by a period of extremely low volatility (i.e. 2017 – January 2018).
Here’s today’s study: what happens next when:
Here are the historical cases
Let’s look at these historical cases in detail.
*We are eliminating all the cases that occurred near a recession because the economy is nowhere near a recession today. U.S. economic growth is solid. The next recession is at least 1 year (12 months) away. The economy and stock market move in the same direction over the medium-long term.
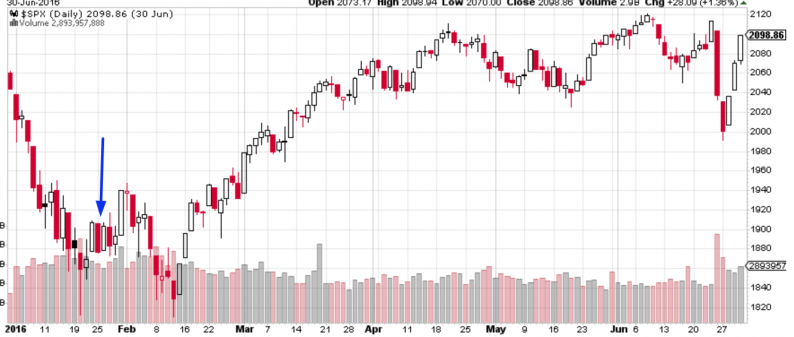
January 25, 2016
The S&P went down over the next 3 weeks. The next 6%+ “small correction” began 5 months later in June.

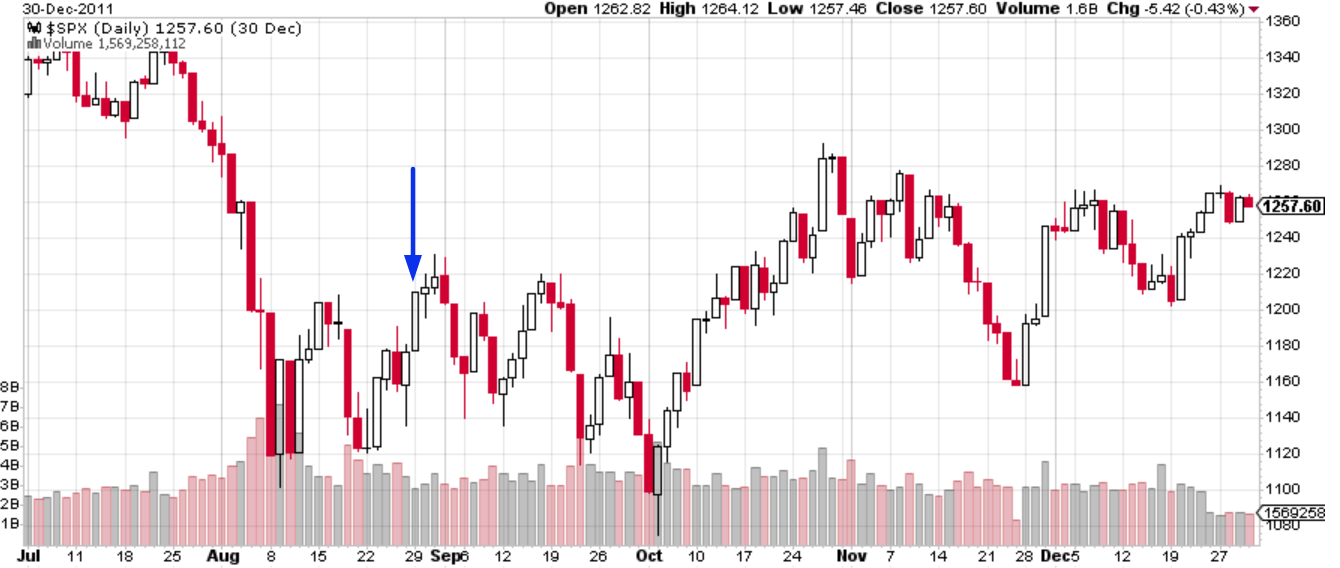
August 29, 2011
The S&P went down over the next month. The next 6%+ “small correction” began 7 months later in April 2012.
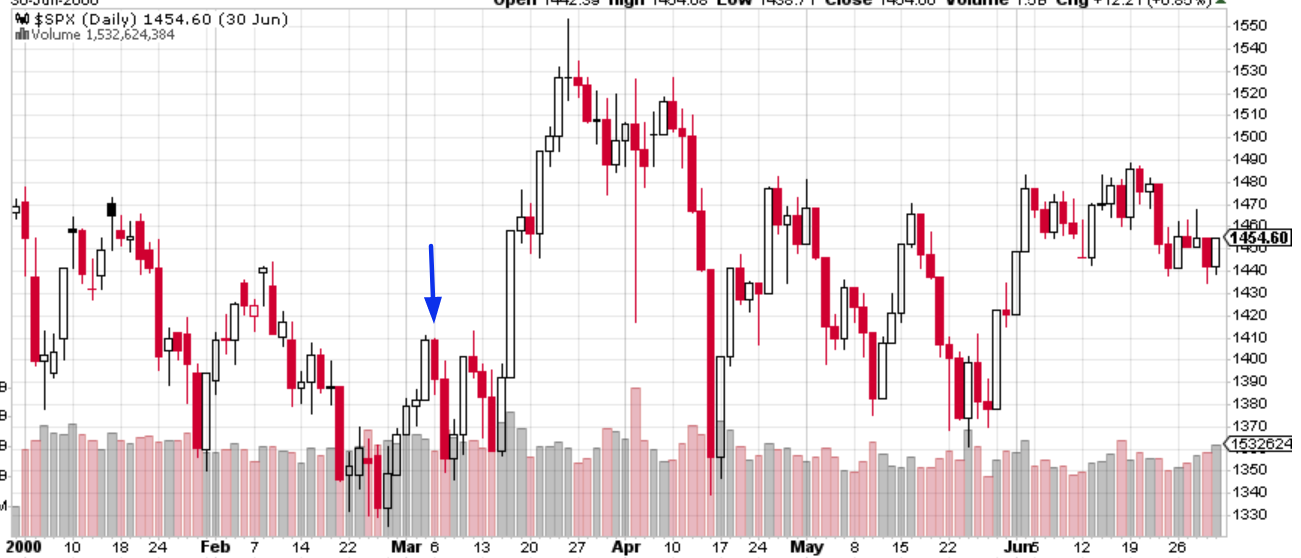
March 7, 2000
The S&P swung sideways over the next week. Then it rallied for 2 more weeks before the bull market topped on March 24.
December 15, 1997
The S&P went down over the next 3 weeks. There was no “small correction” before the next “significant correction”. The next “significant correction” began 7 months later in July 1998.


Leave A Comment